September 2023, Vol. 250, No. 9
Features
How Emissions Are Measured: Gas Concentration vs. Emission Rate
By Asa Carré-Burritt, Director of Policy and External Affairs, Bridger Photonics
(P&GJ) — The U.S. Pipeline and Hazardous Materials Safety Administration (PHMSA) proposed a rule in May that included significant measures to reduce emissions from pipelines and other midstream infrastructure.
The rule, Pipeline Safety: Gas Pipeline Leak Detection and Repair, proposes instrument-based leak detection with a gas concentration detection sensitivity requirement of 5 parts per million (ppm).
This detection sensitivity requirement, expressed only in units of ppm, could make it difficult to implement remote sensing technologies for regulatory compliance because remote sensing measures gas concentration in different units.
It’s essential for regulators and operators to understand the significance of units used to describe gas measurements, which can vary widely depending on the type of gas sensing technology used. Point sensors (like flame ionization detectors or cavity ringdown spectrophotometric detectors) typically report ppm concentrations.
However, remote sensing technologies (such as aerial LiDAR sensors and solar infrared imaging spectrometers) measure path-integrated gas concentration in units of parts per million-meter (ppm-m, not to be confused with ppm).
Point sensor systems that measure concentration are often used by foot patrols, mounted on vehicles, or several can be situated around a particular location. These systems are sometimes referred to as “in-situ” detectors because the emission must come into contact with the sensors for a concentration measurement to be made.
Meanwhile, remote sensing systems use light (in many cases from a laser or from the sun) to detect gas from afar. These technologies can also be deployed by foot patrols, mounted on vehicles, or can be situated near potential emission sources, but the ability to make long-distance measurements makes it particularly attractive to mount remote sensors on airplanes, helicopters and even satellites.
Emission Concentration
The term “gas concentration” refers to how much of a gas, either in mass or in molecules, is present at a certain time and location. Parts per million, or ppm, is a commonly used unit of gas concentration measurement. Gas concentration is also referred to as a “mixing ratio,” because it describes the amount of a molecule of interest (e.g. methane) relative to other molecules present in a sample.
As an example, a methane molecular concentration of 2 ppm means that two out of every one million air molecules are methane. This is close to the typical background concentration of methane in the lower atmosphere (approximately 1.9 ppm by volume, according to NOAA). In the extreme, one million ppm means that every molecule in a sample is methane (i.e., pure methane gas).
A benefit of measuring concentration in terms of ppm is that these measurements can be used to identify hazardous conditions, such as the lower explosive limit of methane (50,000 ppm).
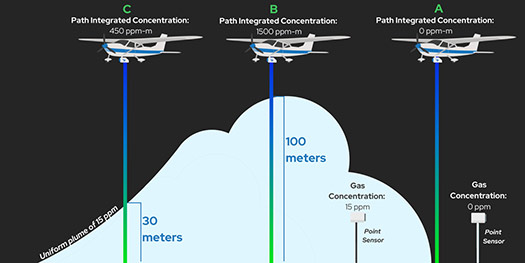
In contrast to the concentration units of ppm, path-integrated concentration units of parts per million-meter (ppm-m) refer to how much gas is present along a column of air, thereby including an element of distance. Specifically, path-integrated concentration is the summation of the molecular concentration across every measured meter of the column of air in the light path of a remote sensor (Figure 1).
For example, if one were to measure a path-integrated methane concentration along a column of a gas plume with a methane concentration of 5 ppm in the first meter of the column, 3 ppm in the second meter of the column, and 2 ppm in the third meter of the column, then the path-integrated methane concentration would be 10 ppm-m (5 ppm x 1 meter + 3 ppm x 1 meter + 2 ppm x 1 meter), assuming there was no more methane present in the remainder of the column.
Another simplified example of how path-integrated concentration units of ppm-m are determined (Figure 1), where the path-integrated concentration is determined by multiplying the concentration of the plume, (in this case the plume is uniformly 15 ppm) by the height of the plume (variable).
Path-Integration
Path-integrated concentration measurements can be used to estimate the mass flow rate or “emission rate” of a gas in kilograms per hour (kg/hr). Mass flow rates can be converted into volumetric flow rates described by liters per minute (l/m) or standard cubic feet per hour (scf/hr) using gas densities. Emission rate estimates provide a way to assess how much gas might be released from an emission source over a period such as a month or a year.
In addition to remote sensing data, there are many ways to measure emission rates such as: “bagging” (i.e., trapping the leaking gas), flow meters, high-flow samplers, dual tracer flux measurements and mathematical models used by point sensor networks.
The most suitable quantification method often depends on the nature of the emission source, such as the temperature of the emitted gas, the true emission rate, emission source height, gas composition, and emission orifice. In general, each method is subject to a unique set of practical limitations. Several of these methods also require a different technology for initial emission detection prior to quantification.
Several remote sensing-based technologies can use the path-integrated concentration measurements (ppm-m) to map the detected gas plumes and create plume imagery, such as solar infrared imaging spectrometers, and Bridger Photonics’ aerial Gas Mapping LiDAR technology. The resolution of gas plume imagery is dependent on technology.
Aerial remote sensing overcomes many experimental challenges in emission rate quantification by being able to efficiently evaluate emissions within line of sight from the air. Emissions from elevated sources are readily quantified using this approach, and emissions from underground sources are measured when gas reaches the atmosphere.
Aerial deployment means that hundreds of sites, or hundreds of miles of pipeline, can be evaluated in a day. However, the accuracy of remote sensing quantification may depend on the accuracy of available wind data, other inputs, and the models used to estimate emission rates from path-integrated gas concentration measurements.
It’s important to review third-party studies to understand the quantification accuracy of a given remote sensing technology to ensure that it suits the application.
Measurement Units
Different use cases will dictate which type of measurement deliverables are preferred, and subsequently which emissions detection technology is suitable. The distribution sector, for example, may require emission rate and concentration measurements, since concentration measurements in ppm are a direct indicator of safety, and emission rate estimates give operators insight to the magnitude of the emission itself, which has both safety and environmental implications.
For upstream and midstream infrastructure, emission rate measurements may have greater importance relative to concentration measurements because they allow operators to assess total emissions and track changes over time.
Emission measurement types, and whether quantification is possible based on the data collected, are important factors to consider when selecting technology for an emissions detection program, but they aren’t the only factors.
Ideally, technologies should be able to provide their emission rate detection sensitivity defined by the probability of detecting a certain emission rate (e.g. a 90% probability of detecting 5 kg/hr emissions).
The spatial resolution of emission source identification is also important; knowing the source location down to just a few meters, compared to within a broader area of several hundred meters provides valuable information for maintenance and repair crews.
Other potentially important factors include whether the technology can image emissions, and how efficiently it can be deployed.
Key Takeaways
Emissions monitoring data in units of ppm, ppm-m, or emission rate all provide valuable information to oil and gas operators, but they are not interchangeable – each measurement type has a distinct meaning and application.
Concentration measurements (ppm) are a direct indicator of safety, while path-integrated concentration units (ppm-m) can be used to generate emission rate estimates (kg/hr or scf/hr) and gas plume imagery, which aid in identifying sources and tracking changes in emissions over time.
Selection of emissions detection technologies and the resulting data deliverables depend on the requirements of the specific emissions management program. Additional emission detection performance factors are also essential to consider.
By making informed choices with a strong understanding of the different types of data generated from different classes of emissions detection technology, the oil and gas industry can most effectively monitor and mitigate emissions.

Comments