July 2019, Vol. 246, No. 7
2019 P&GJ Metering & Measurement
Oil Prices and the Flowmeter Market
By Jesse Yoder, President, Flow Research, Inc.
The worldwide flowmeter market experienced a rebound in 2018, with this particular market having followed the upward and downward fluctuations in oil prices, traditionally.
When oil prices began dropping five years ago and many oil and gas exploration projects were postponed or canceled, associated instrumentation industries experienced a ripple effect.
The impact was especially strong on Coriolis and ultrasonic flowmeters. About 30% of Coriolis meters are sold into the oil and gas industry, along with refining, while these industries account for about 40% of ultrasonic flowmeter sales.
Ultrasonic flowmeters are widely used for custody transfer of natural gas, especially in the midstream segment. Here they compete with differential pressure and turbine meters. Most Coriolis meters are not practical for these applications, due to the large line sizes involved, although some manufacturers are now making Coriolis meters that can accurately measure flow in pipes of 8 to 16 inches in diameter.
In 2014, the price of oil exceeded $100 per barrel throughout most of the first half of the year. However, in August 2014, prices began declining for the rest of the year. By the end of 2014, oil prices stood at just above $50 per barrel. In 2015, oil prices ranged between $40 and $60 per barrel for most of the year. By the end of 2015, however, the price of a barrel of oil fell below $40 per barrel, reaching a low of $34.55 on Dec. 21, 2015.
This downturn in oil prices set the stage for a significant drop in flowmeter sales worldwide. The price decline especially affected the Coriolis, ultrasonic, differential pressure, positive displacement, and turbine flowmeter markets.
In 2015, for the first time in many years, new-technology flowmeter markets showed a decline. The only exception was a small revenue increase for magnetic flowmeters, which cannot measure the flow of hydrocarbons and therefore are not widely used in the oil and gas industry. The value of the worldwide flowmeter market declined from $6.7 billion in 2013 to $6.5 billion in 2015.
Of course, oil and gas and refining are not the only industries that flowmeters sell into. The largest industry for flowmeters beside oil and gas and refining is chemical. Other major industries for flowmeters are water and wastewater, and power. The food and beverage, and pharmaceutical industries also account for significant portions of the flowmeter industry.
The Great Recession of 2008 had a more widespread affect on the flowmeter markets, since a wide range of industries were severely damaged by the economic events surrounding this recession. Ironically, oil prices were at their highest during the first half of 2008, peaking at $145.31 per barrel on July 3, 2008. However, this did not last, and on Dec. 23, 2008, the price of oil per barrel stood at their low for the year, at $30.28 per barrel.
What’s ‘the Price’ of Oil?
So far, the assumption of this article has been that there is one value called “the price of oil.” In reality, this is an oversimplified view of the situation. The process of drilling for oil is incredibly complex, and the type of oil that comes from the ground varies widely by the underground terrain, its history and location, and many other factors.
Oil is classified by many characteristics, including viscosity, sweet vs. sour, API gravity, and other qualities. These qualities vary greatly with the country in which it is drilled, and with the location within the country. For example, oil from Venezuela is heavy and sour, meaning it is very dense has contains a lot of sulfur. Much of the oil from the United States, by contrast, is light and sweet. This means it is less dense and contains relatively less amounts of sulfur. Oil is considered “sweet” if it contains less than 0.5% sulfur.
Rather than there being one value called “the price of oil,” there are more than 150 different types of crude oil, each with its unique characteristics and name. Tracking the pricing of all these types of oil on a daily or hourly basis would be both difficult and confusing. As a result, four types of oil have emerged as “benchmarks” that play a central role in determining crude oil prices. These four types are as follows:
- West Texas Intermediate (WTI)
- Brent crude
- OPEC Reference basket
- Dubai/Oman basket
WTI consists mainly of oils that come from Texas and surrounding states. It is traded on the New York Mercantile Exchange. WTI, which has low sulfur content, is transported to Cushing, Oklahoma from US oilfields. It is refined in Cushing. WTI has become a benchmark for oil sold in the United States. The prices of oil quoted earlier in this article were the prices of WTI oil.
Brent crude oil is mainly associated with the oilfields of Norway and the United Kingdom. It is the benchmark for oil sold in Europe, Africa, Australia, and some Asian countries. Like WTI, Brent is both light and sweet, but it is slightly heavier than WTI.
The OPEC Reference basket is the name for a blend of oils from most OPEC countries, including Saudi Arabia, Kuwait, and Iran. The OPEC secretariat in Vienna, Austria determines its value.
The Dubai/Oman basket consists of oils from Oman, Dubai, and Abu Dhabi. It is slightly sour and heavier than both WTI and Brent. Dubai/Oman oil is traded at the average price of oils from these three countries. It has become the benchmark for oil shipped to Asia.
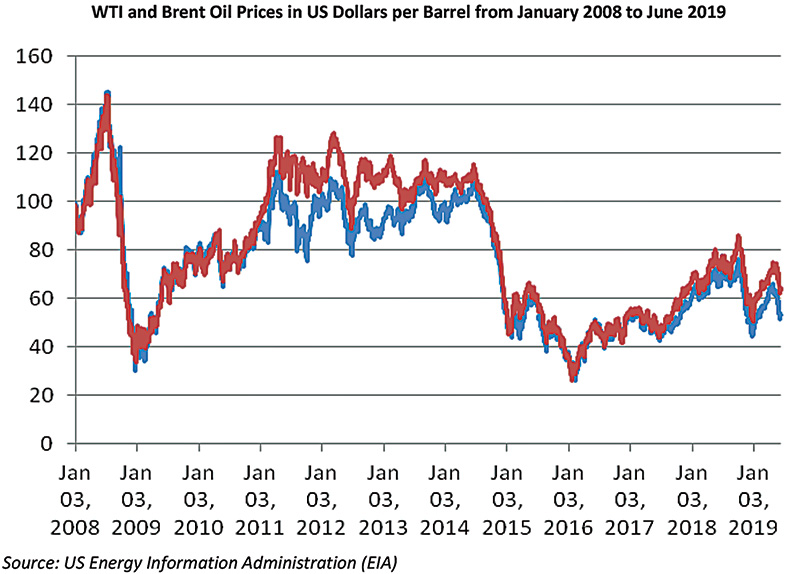
A comparison of the prices of WTI and Brent oil from 2008 through June 2019. There are a number of interesting facts about this chart. One is that WTI and Brent traded at close to the same values between 2008 and 2011. Beginning in 2011, however, Brent crude generally began to exceed the price of WTI.
That has remained true until today. The chart also shows the extent to which prices plunged from a high of nearly $146 per barrel in July 2008 to a low of just over $30 per barrel in December 2008. This was coincident with the Great Recession of that period.
Prices vs. Flowmeters
Oil prices are fundamentally determined by supply and demand. However, anyone who has followed oil prices over the past five years knows that OPEC’s decisions on whether or not to initiate production curbs has been a fundamental determinant of oil prices. At the same time, the advent of fracking in the United States has actually worked against OPEC’s attempts in the past three years to support prices, since US fracking has increased the total oil supply on the market. Despite this, WTI prices have stayed fairly close to $60 per barrel in 2019.
Looking at the oil price chart, it is possible to correlate total worldwide market size with oil prices. In 2013, when oil prices were relatively high, the total size of the worldwide flowmeter market was $6.7 billion. In 2015, after oil prices dropped substantially, the flowmeter market contracted $200 million to $6.5 billion. By 2018, after oil prices had recovered and many delayed or even previously cancelled projects were back online, the total worldwide flowmeter market increased to $7.0 billion.
New-Technology Flowmeters
Of course, the size of the worldwide flowmeter market only provides a high-level snapshot of the entire market. This size is determined by adding up the sales of the ten main types of flowmeters. These can be divided between new-technology and traditional technology flowmeters. New-technology flowmeters were introduced in 1950 or later and are the main focus of product development by many manufacturers.
These flowmeter types include Coriolis, magnetic, ultrasonic, vortex, and thermal. Traditional meters were introduced before 1950. They include differential pressure, positive displacement, turbine, open channel, and variable area flowmeters.
Flow Research has data going back to 2003 that shows the gradual shift of the total flowmeter market from traditional meters to new-technology meters. While new-technology meters have product development on their side, traditional meters have a large installed base that keeps them in business.
And some manufacturers have introduced product improvements as well to traditional meters. In general, traditional meters are growing in the 1-2 % range each year, while new-technology meters are growing in the 4-7 % range each year. Some new-technology meters grew at a faster than average rate in 2018, which was a banner year for the flowmeter market.
So far, this trend seems to be holding in 2019, though some economists are calling for a slowdown towards the end of 2019 or in 2020. It remains to be seen whether this occurs, and to what extent this will impact the flowmeter market.
Change in Flow
While all these changes are occurring in the flowmeter market, there is a steady drumbeat of acquisitions and realignment going on within the market. Honeywell has acquired Elster to form Honeywell-Elster. Schlumberger has acquired Cameron, which previously acquired Caldon and formed Nu-Flo. Now Schlumberger is forming a joint venture with Rockwell to create a new entity called Sensia. Schneider Electric has acquired Foxboro to form Foxboro by Schneider-Electric.
TASI Group, which itself is a collection of six flow companies including AW-Lake and Kem Kueppers, has purchased Onicon. Onicon itself had previously assembled a group of companies including Seametrics, Air Monitor, Fox Thermal Instruments, and Greyline.
After it purchased Onicon, TASI Group next acquired Sierra Instruments. These deals were orchestrated by Berwind Industries, the parent company of TASI Group. At the same time, TASI has become a distribution channel for the ultrasonic and magnetic flowmeters of ELIS Plzen of the Czech Republic.
Of course, acquisitions are nothing new in the flowmeter industry. General Electric (GE) purchased Panametrics and Siemens purchased Controlotron. GE bought Rheonik in 2007 and then spun them off in 2015. But the more recent acquisitions have been larger in scope and more frequent than in recent memory. Why is this?
There is an explanation for this acquisition activity that makes involves the shift to new-technology flowmeters and the increasingly sophisticated nature of flowmeters. It also involves the increased importance of software to flow measurement, the importance of networking, and the increasing sophistication of flowmeters themselves.
Many companies are seeing the market shift to Coriolis, ultrasonic, and magnetic flowmeters, and they realize that if they want to be around in five years that they need to participate in these new-technology markets. Secondly, flowmeters themselves are becoming more complex.
Other examples include advances in multiphase and watercut meters. The technology for these meters is highly complex, and often is not so much a single meter as a skid that incorporates other meters such as Coriolis and Venturi tubes. Producing multiphase and watercut meters that are both reliable and reasonably priced remains a challenge for many companies.
The flowmeter market is full of $1 million – $5 million companies. There are also a significant number of $10 million – $20 million companies. Many of these companies have developed unique technology that is application specific, and they serve an important role in the flowmeter market.
The problem these smaller companies have is that the market is moving toward much more sophisticated products that in some cases require multi-million dollar research budgets. Some of these companies simply do not have the resources to compete with the larger companies putting out much more advanced technology.
The smaller companies can compete on service and distribution channels, but ultimately, they are likely to be forced to become part of a larger enterprise to survive. This is why you can expect more consolidation in the flowmeter market in the next several years. P&GJ


Comments