July 2015, Vol. 242, No. 7
Features
Latest in Pressure Cycle Induced Fatigue Crack Growth Modeling
Recent high-profile pipeline incidents have increased awareness of integrity threats associated with legacy seam-welded pipe. Additionally, expectations from the public, regulators and pipeline operators to effectively manage these threats have increased.
Pipeline operators use guidance published in PHMSA’s TT05 – Low Frequency ERW and Lap Welded Longitudinal Seam Evaluation– to model the effect of pressure cycle-induced fatigue on the growth of crack flaws to determine the optimum integrity re-assessment date prior to their growth to a critical level.
Operators typically considered a short window of pressure cycling data to represent the historical operations of a pipeline. But, there is now an expectation to analyze a larger chronological representation of pressure cycle data at a higher resolution to accurately model the complete effects of the entire operating history of a pipeline on the growth of crack flaws.
Based on new studies published by PHMSA and a recommended practice pending publication by API (API RP1176), coupled with increased knowledge of operators’ pipelines, a better tool is clearly needed to analyze the effects of pressure cycles that allows for quick adaptation to variations in criticality equations, material properties (toughness) and operations changes (such as changes to M(A)OP).
Integrity Solutions has developed a database-driven software platform that allows the operator to sample large continuous data sets in a near real-time manner. By using this platform pipeline operators have effectively met the increasing challenges associated with managing this unique threat.
Regulatory, Industry Standard Citations
Pipeline integrity management regulations for both natural gas and hazardous liquid pipelines dictate that operators must choose an assessment method capable of assessing seam integrity for pipe that is susceptible to longitudinal seam failures.
While performing an integrity assessment such as a pressure test that meets the requirements of the applicable section of code is an option, often it is impractical to apply this assessment technique to all pipelines without screening for susceptibility first.
Many operators perform an engineering evaluation to determine how susceptible the pipeline is to seam failures based on operational parameters that include the percent of SMYS at M(A)OP, the severity of pressure cycling, and the data associated with historical pressure tests. The results of this engineering evaluation can provide a pipeline operator with the information necessary to determine if the pipeline is susceptible to seam failures and therefore requires an integrity assessment.
This type of engineering evaluation is also useful where a baseline assessment of either a pressure test or an inline inspection (ILI) capable of assessing seam integrity was conducted and the operator needs to determine an appropriate reassessment interval as required by the regulations.
In addition to the requirements specified in code, several other industry standards and publications (TTO5, API RP1160, ASME B31.8S, API RP579, API RP 1176 (pending publication), Battelle – (PHMSA Study 2012) provide guidance for performing an engineering evaluation to estimate the remaining life of either measured flaws or potential flaws that would have just survived a previous pressure test.
Implementation
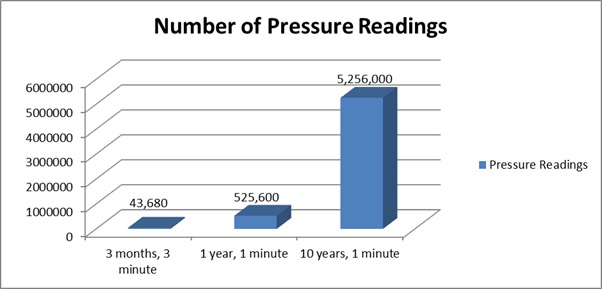
Historically, pressure-cycling analysis used a small sample window, typically three months, of data at three-minute intervals or greater. TTO5 recommends one-minute intervals for liquid and hourly readings for gas. As shown in Figure 1, the number of pressure readings increases almost exponentially when a larger sample window and higher resolution data are both employed. Using a spreadsheet limits the number of records that an operator can consider for a given analysis. A database-driven software platform enables consideration of a much larger dataset with minimal impact on computation time.
A good pipeline integrity program should drive changes in the pipeline system that may reduce the likelihood of a threat. Flow direction reversals, increases in operating pressures, changes in batching, abnormal operating conditions (surges) could all influence the growth rate of a potential seam crack. Integrity analysts need a tool robust enough to provide an analysis of these operational changes to determine if the original crack reassessment interval should be adjusted.
Furthermore, scenarios can be performed for anticipated changes to better understand the effect the change will have on the threat. The results of these scenarios can form the basis of proposed efforts to mitigate additional risk posed by the operational change.
During post-incident investigations, analysis may be needed to better understand how pressure cycles may have contributed to the failure. This type of analysis should be done prior to reactivation of a pipeline to help identify what type of mitigative measures (e.g., pressure reductions, changes in operating procedures) the operator should implement to reduce the likelihood of a similar failure in the future.
Workflow
As part of an effective program to manage the long-seam threat, some pipeline companies perform an engineering analysis to determine the impact of pipeline pressure cycling on a potential or actual crack feature associated with the susceptible long seam on their low frequency ERW or electric flash weld (EFW) pipes. To aid in this effort, PHMSA commissioned the creation of TTO5, an informational document that describes an effective method for performing this analysis.
These analyses have typically been performed using a series of spreadsheets built to perform the calculations. This method, while effective, is labor intensive and the workflow must be repeated for each individual analysis (analysis is defined as the calculation performed on a single pipe record, with a single group of pressure values, and a single starting crack size). As noted, the use of spreadsheets also limits the number of pressure readings that can be used for an analysis.
Data handling and preparation: This type of analysis relies heavily on good quality pressure data as well as accurate pipe properties. If pipe properties are unknown, conservative assumptions should be made or this type of analysis should be reconsidered. TTO5 provides guidance on conservative assumptions to be used in the case of unknown pipe data.
It is of critical importance to ensure that the pressure readings being used for the analysis are representative of the pressure that is experienced at the flaw that is being evaluated.
• For natural gas pipelines, this often means verifying that the pressure transducer is on the same pressure control system as the flaw being evaluated and within a reasonable distance.
• For hazardous liquid pipelines, this typically involves an interpolation between pressure readings from both ends of the pipeline to account for elevation differences as well as frictional losses. An equation for this interpolation can be found in Section 4.3.3.2 of TTO5.
Input-user defined: There is also required data from the software application user. This is data required to configure each of the “analyses” that the application will perform. The configuration of an analysis is saved such that it can be run in the future with updated pressure data. User-defined data includes Pipe Properties, Pressure Data, M(A)OP, Field Measured Crack Dimensions or Test Pressure (for calculated crack dimensions).
Determine initial flaw size: The TTO5-based analysis consists of growing (growth due to pressure cycling) an actual or assumed crack from an initial size. TTO5 provides a method for calculating an assumed crack length as a function of the diameter and the wall thickness. If the “calculated” crack option is chosen, the length is calculated per TTO5 and the depth of the crack that would have survived a pressure test is calculated. Whichever method is selected, the calculated OR given depth is the “begin-depth”.
Determine crack depth at critical pressure: The user is also required to provide an M(A)OP or other critical pressure, for example 110% of M(A)OP. The software calculates the depth of a crack (at the initial crack length) at which the predicted failure pressure is equal to the critical pressure. This is the “end-depth.”
Condition SCADA data: Pipeline operators will have several decisions and limitations to make regarding which and how much pressure data is used in the analysis. Experience indicates that there are typically invalid pressure results that will need to be “conditioned” in order to be used in the analysis.
Use SCADA data to create %SMYS records: The TTO5 analysis uses cycles through a %SMYS of the pipeline. As such, the pressure readings must be converted to a corresponding %SMYS of the pipeline. The pressure and pipeline data acquired from the connected views provide the inputs for this calculation.
Perform Rainflow Counting on %SMYS data: ASTM E1049 – Standard Practices for Cycle Counting in Fatigue Analysis (E 1049 – 85: reapproved 2005) details methodologies for performing cycle counting. The software uses the rainflow counting method detailed in section 5.4.4 of ASTM E1049. Cycle counting results in a dataset that reports all of the cycles counted from the input data along with the magnitude of the cycle (in terms of %SMYS – a line operating at 50% of SMYS that cycled from slack to M(A)OP would have 1 cycle through 50% SMYS).
The cycle counts are put into bins based on their magnitude for comparison to the Benchmark Cycle Counts that are published in Table 4.1, TTO5 REV 3, April 2004.
Calculate crack growth rate and remaining life: Once the initial and final crack dimensions have been determined and the pressure cycles have been calculated, the remaining life of the flaw can be calculated. In order to calculate the remaining life, the crack growth per pressure cycle must be calculated.
TTO5 provides the Paris-law approach to calculate the rate of crack depth growth per pressure cycle, assuming a semi-elliptical surface flaw.
Calculate time to failure: Using the initial and final flaw sizes, pressure cycles counted over a period of time, and calculated crack growth rate, a remaining life or time to failure (TTF) can be calculated.
TTO5 section 4.3.5 indicates the use ½ of TTF for the manufacturing threat reassessment interval is the normal practice.
The calculation above can be used in at least two ways, a grouped methodology as defined in TTO5 or a more detailed individual cycle methodology as developed by Integrity Solutions.
Conclusion
A failure from a seam rupture can have tremendous consequences. It is vital that the best tools are employed to manage this threat. Seam crack assessment database-driven software is flexible enough to calculate assumed crack parameters based on data from historical hydrostatic tests, ILI crack assessment tools, or direct field and lab measurements.
With a more efficient analysis tool like this, pipeline operators can study a broader spectrum of representative data and also analyze predictive scenarios or perform iterative sensitivity analyses. Studies can be expanded to pipeline assets not traditionally considered for pressure-cycle analysis to understand the effects of pressure-cycle crack growth on dents, gouges and other stress concentrators where potential failure is further influenced by pressure fatigue.
This systematic approach minimizes the potential for human error in data processing and allows for a more systematic archive platform so that past studies are readily available for future trending or integrity program audits. The overall results equate to “integrity knowledge” that can be easily incorporated into the risk management of the pipeline portfolio.
Authors: Chad Haegelin is a senior integrity management consultant for Integrity Solutions, Ltd. who provides consulting services in regulatory compliance management, pipeline facility risk analysis, pipeline/facility integrity assessment management (ILI, ECDA, etc.) and risk/integrity management program development. Haegelin has over 17 years of oil and gas pipeline and pipeline facility experience. Prior to joining Integrity Solutions, Ltd., Haegelin was the director of Integrity Engineering at NuStar Energy. He holds a bachelor’s degree in mechanical engineering from Texas A&M and a master’s degree in industrial engineering from the University of Houston.
Derek J. Johnson is a senior integrity management consultant and principal owner of Integrity Solutions, Ltd., Johnson has over 11 years of experience in engineering and project management in the oil and gas pipeline design, construction and integrity management fields. Prior to joining Integrity Solutions in 2007, he worked for AI Bass-Trigon and Rooney Engineering. He holds a bachelor’s degree in mechanical engineering from the Colorado School of Mines.

Comments