
July 2009 Vol. 236 No. 7
Features
Quantification Of The Effects Of Dirty Upstream Pipe On Ultrasonic Meter Performance
The flow measurement performance of two commercially available ultrasonic flow meters has been evaluated under conditions in which there were various levels of contaminate-like coating applied to the inside wall of the pipe upstream of the meter.
The tests were performed under controlled conditions in the Southwest Research Institute Metering Research Facility (MRF) High Pressure Loop (HPL) and were designed to compare the baseline (clean pipe) flow measurement performance of each meter to the performance attained with various levels of coating on the upstream pipe.
The tests used 8-inch multipath ultrasonic meters and were performed at nominal operating conditions of 800 psia at 70°F using transmission-grade natural gas. The baseline performance of each meter was established by testing with honed pipe upstream. Meter tests were then repeated after the internal surface of the upstream pipe had been coated to simulate pipeline contamination. The meters were not coated for these tests.
Test Meters
Daniel and Instromet each provided an ultrasonic gas flow meter for use in this program. The meter path configurations are shown in Figure 1. Inspection of the meter parameters suggested that the meters were previously calibrated; however, no additional adjustments were made to the meters for the testing described in this article. It should be noted that other meter manufacturers were willing to provide meters for testing, but the Pipeline Research Council International (PRCI) committee members decided to focus on the Daniel and Instromet meters.

Figure 1: Meter Path Configurations.
Data Collection And Processing
The meters were tested with transmission-grade natural gas (i.e., approximately 95% methane gas mixture) furnished by the local utility company. Data were collected simultaneously from the test meter and from the MRF HPL critical flow nozzle bank, which served as the flow rate reference. The five binary-weighted critical flow nozzles in the HPL nozzle bank were previously calibrated in-situ, at different line pressures, against the HPL weigh tank system.
The volumetric flow rate, as well as the individual path status, flow velocity, and speed of sound data reported by each ultrasonic meter were digitally acquired during each flow point. Digital data were read from the test meter using the UNIFORM protocol for the Instromet meter and the MODBUS protocol for the Daniel meter.
Meter Installation
Each test meter was installed in the HPL header area with upstream piping that consisted of the vane portion of the Gallagher flow conditioner installed immediately downstream of a 12-inch by 8 inch reducing section, followed by a 5D pipe spool and a Gallagher perforated plate flow conditioner. An additional 10D of pipe was installed downstream of the flow conditioner prior to the two 10D sections of honed pipe specifically constructed for this testing. The upstream piping configuration was identical for testing performed with both meters; however, because of differences in the meter lengths, the downstream piping differed.
The testing required that the meters and the upstream piping be repeatedly removed and re-installed. To ensure repeatability of the setup, the upstream bore of the meter was carefully aligned with the upstream piping (through visual inspection) prior to installing the downstream piping. All of the piping was marked to maintain the same orientation from test to test.
Upstream Pipe Characteristics
Two 10D long upstream pipe spools were manufactured for this test. The spools were honed to 7.981-inch bore and had an initial measured roughness of approximately 1.3 ?m.
The substance that was used for coating the pipe was a polyurethane-based material with self-contained rubber granules. The product is sold under the trade name Herculiner and is intended for use as a slip-resistant safety coating. This material was chosen because it could be applied like paint and provided a uniform, consistent coating on the pipe walls. The upstream pipe was coated in three steps to simulate three different buildup thicknesses.
According to the manufacturer’s documentation, each application of the Herculiner coating was expected to provide a buildup of approximately 0.040 inches of material. However, the actual buildup amount was lower.
[inline:[inline:GTab1.PNG] ]
Table 1. Coating Thickness and Roughness Measurements.
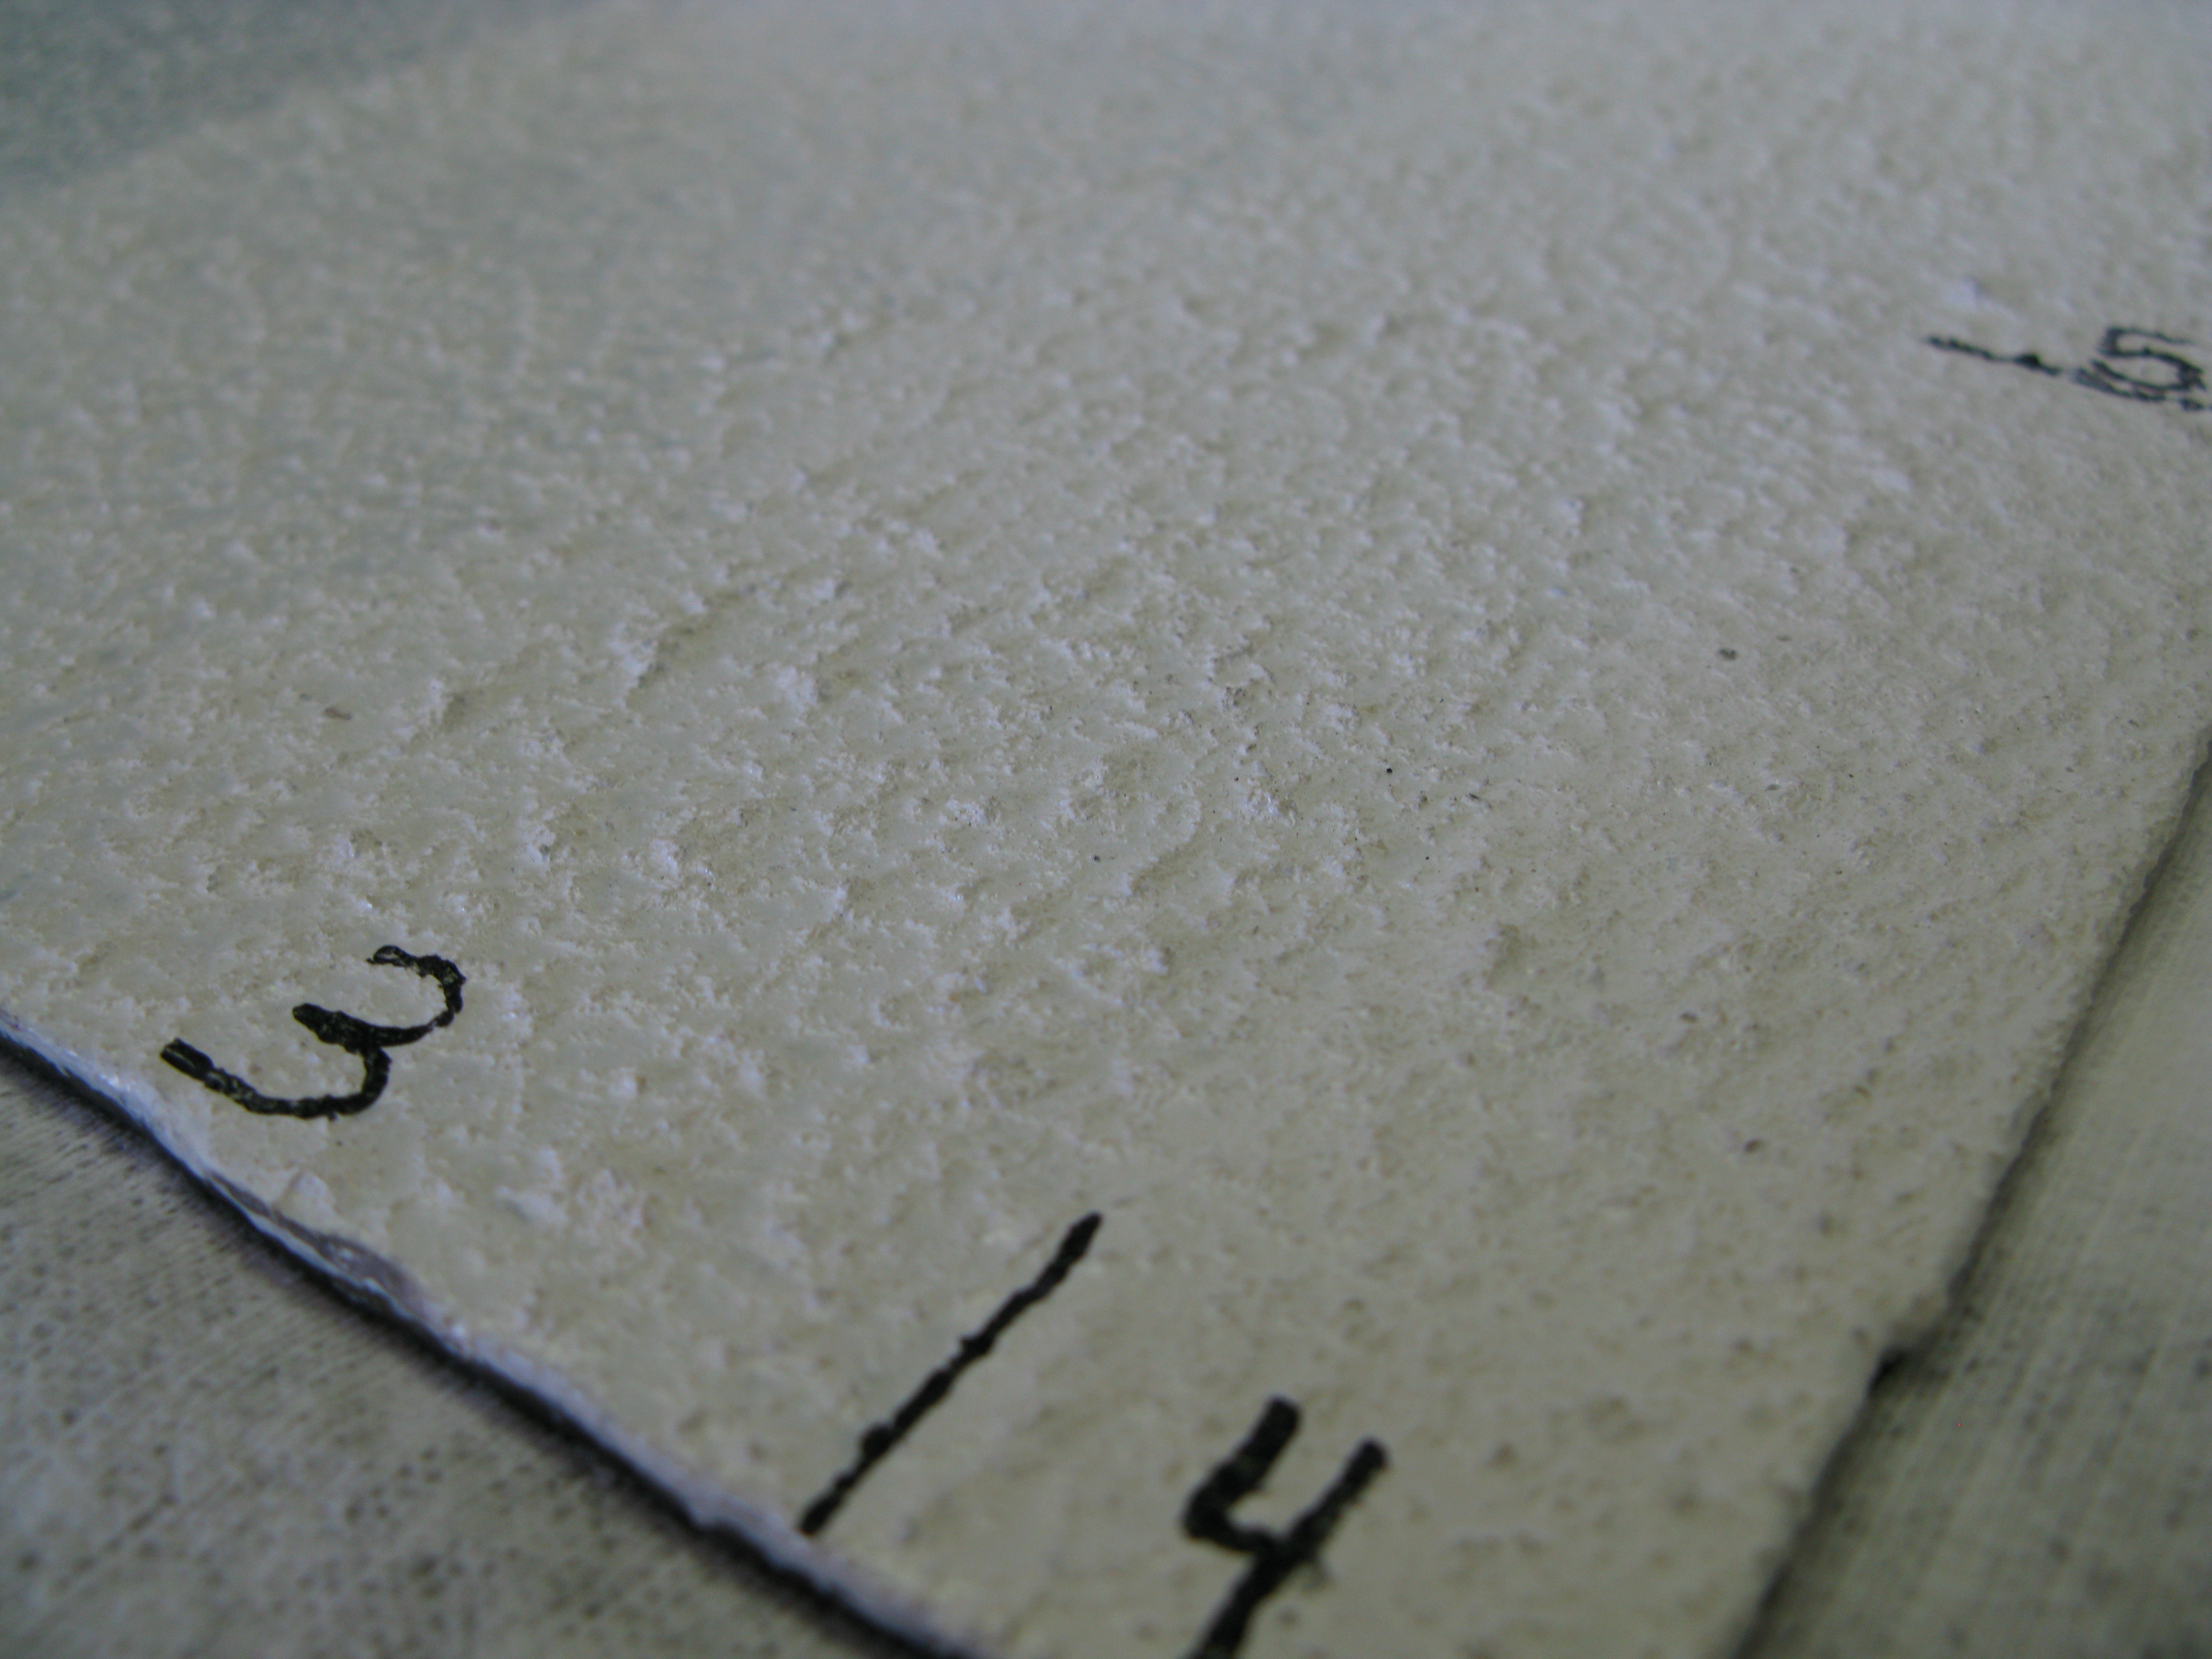
Table 1 shows a measure of the coating thickness at two sample locations on the test block and the average roughness (Ra). Because of the large variation in the surface height, a standard profilometer could not be used to measure the surface roughness. Instead, a coordinate measuring machine (CMM) was used to scan the surface of the sample plate to determine the height variation caused by the different coating levels. The average roughness height (Ra) was then determined from CMM data after the data were corrected for a slight curvature in the sample plate. Note that not all coating levels were actually tested. Figure 2 is a close-up view of the surface produced by multiple coats of the Herculiner material.
[inline:[inline:GFig2.PNG] ]
Figure 2: Close-up of Coating Surface. The thickness and surface variability increased with the number of coating applications.
Initial Tests
Initial tests were conducted with an uncoated, honed meter tube to establish a baseline to which tests with the coated pipe could be compared.
The test results are presented in two forms: a plot of the meter error as a function of the bulk velocity and a plot of the path velocity ratio as a function of the bulk velocity. The meter error has been calculated relative to the MRF critical flow reference. The tests with the uncoated pipe were used to establish a correction factor for each meter. All subsequent flow data (with the coated upstream pipe) were adjusted for the baseline test.
Tests with the honed pipe were conducted to establish a baseline reference to which the coated pipe test results could be compared. For each flow rate, six 90-second long repeat points were used to establish the meter error at a particular flow rate and create a baseline curve.
The baseline curves were used to determine an average meter factor (output multiplier) that could be used to correct the meter output to match that of the MRF critical flow reference. Although the meter correction factor was not entered into the meter, the data for the subsequent plots were adjusted to reflect the baseline meter correction (just as if it had been entered into the meter). The error curves for the results with the coated pipe were labeled as relative error, since they are relative to the baseline test results.
Relative Error Curves
Figure 3 and Figure 4 show the results of the Daniel and Instromet meter tests with one, two, and four coats of material on the upstream pipe. The adjusted baseline curves are also provided as a reference. The figures provide the average error relative to the baseline-adjusted meter; therefore, these curves represent the change in performance relative to the baseline tests.
[inline:[inline:GFig3.PNG] ]
Figure 3: Daniel Meter Relative Error Curve. A shift of approximately 0.2% was evident for the four-coat test.
The results for the Daniel meter show no appreciable change in the meter’s performance, with the exception of the results with four coats. The change in performance with two coats was a negative shift in the error curve of approximately 0.2%. Although contamination inside the meter caused a reduction in flow area, which generally caused a positive meter error, here the shift in error was negative. Since the interior of the meter was not coated, there was no change in the flow area; therefore, the negative shift can be attributed to the effect of the profile change on the integration method used to combine the individual path velocities.
[inline:[inline:GFig4.PNG] ]
Figure 4: Instromet Meter Relative Error Curve. A shift of approximately 0.2% was evident for the two-coat test.
The results for the Instromet meter show no appreciable change in the meter’s performance, with the exception of the results with two coats. With two coats, the meter error curve shifted approximately 0.2% relative to the baseline curve. However, the results with additional coats of material on the upstream piping were in close agreement with the baseline test. Because the calculation (path combination) method of the Instromet meter is proprietary, it is not clear if the two-coat result was an outlier or resulted from the calculation method.
Calculation Of The Path Velocity Ratio
The shape of the velocity profile within a meter can be assessed by forming a ratio of the paths that respond primarily to the flow velocities near the center of the pipe and those that respond primarily to the flow velocity near the outer portion of the pipe. The specific combination of paths used to form the factor depends on the path geometry of the specific meter. The equations below describe the calculation of the ratio of the inner (high) velocity paths to the outer (low) velocity paths for the meters used in this study.
![]()
Where Vi is the meter path velocity on path i as shown in Figure 1.
Path Velocity Ratio Results
Based on the equations provided, the path velocity ratios were calculated and plotted for each of the coating tests for each meter. The results are provided in Figure 5 and Figure 6 for the Daniel meter and Instromet meter, respectively. Because each of the meters had unique path geometry, the magnitudes of the path velocity ratios were expected to differ between meter types. However, both meters indicated an increase in the path velocity ratio as the number of coatings applied increased. The increase in path velocity ratio suggested that the centerline velocity had increased relative to the near-wall velocities; this was consistent with increased wall roughness caused by the application of the coating material.
With the Daniel meter, the path velocity ratio increased by approximately 11% between the baseline results and those obtained with four coats on the upstream pipe, while the path ratio for the Instromet meter increased by approximately 5% over the same range of coating change. These results indicate that both meters were capable of detecting the change in velocity profile that resulted from the changes in the characteristics of the upstream piping due to the surface coating.

Figure 5. Daniel Meter Path Velocity Ratio Curve. The path velocity ratio increased by 11% between the baseline and four-coat test case.

Figure 6: Instromet Meter Path Velocity Ratio Curve. The path velocity ratio increased by 5% between the baseline and four-coat test case.
The path velocity ratio results indicated that the velocity profile changed because of the addition of the coating to the upstream pipe and that both meters were capable of detecting the profile change. However, the meter error results suggest that the changes in profile resulted in relatively small changes (0.2%) in the meter performance, even though there was a relatively substantial change (5%-10%) in the velocity profile. These results suggest that the path velocity ratio values can be used to detect a buildup of material on the pipe before the buildup reaches a level that will significantly affect meter performance.
The results further suggest that buildup on the pipe alone must exceed the levels tested for this program before the meter error will exceed 0.2%. Since the meter body and the ultrasonic transducers could not be coated for this testing, conclusions can only be made about the effect of the condition of the upstream pipe.
Conclusions
The project demonstrated the ability of multipath ultrasonic meters to detect changes in the condition of the upstream pipe caused by accumulated material. A ratio of meter path velocities was found to be a good indicator of the condition of the upstream pipe. The path velocity ratio is a parameter that is commonly available in the diagnostic software for ultrasonic meters.
The results also indicated that the meter accuracy was relatively insensitive to the condition of the upstream pipe up to the maximum coating thickness of approximately 0.05 inches tested here. The maximum deviation of the flow measurement over the range of coatings applied during these tests was approximately 0.2% for both meter types. However, the maximum deviation occurred at different coating levels for the different meters.
The coating for this test only involved the upstream pipe. The meter bore and transducer faces were left clean, since it was expected that the coating material could not be removed once it was applied to a surface. However, testing showed that the material could be removed without significant effort; therefore, future tests should involve coating the internal surface of the meter to more closely simulate field conditions.
This would also allow differences between meters with a direct path between the ultrasonic transducers to be compared to a meter in which the ultrasonic energy is reflected off the pipe wall one or more times in between the transducers. Separate tests with and without coated transducers could also be performed to further isolate the effects on the meter and meter tube contamination.
Acknowledgements
This article is based on a presentation prepared for the 2009 American Gas Association Operations Conference hed in Pittsburgh, PA on May 19-21. This project was funded by the Pipeline Research Council International (PRCI). The support and efforts of the members of the PRCI Measurement Technical Committee are appreciated. The test meters were arranged by Dan Hackett and Martin Schlebach from Daniel Industries and Kevin Warner and Patrick Barnes from Instromet, Inc. The willingness of these companies to provide test meters for programs such as this indicates their commitment to helping the industry better understand factors that can affect the operation of their metering technology.
Author
Terrence A. Grimley is a Principal Engineer with the Southwest Research Institute, San Antonio, TX. He graduated from Purdue University with bachelor’s and master’s degrees in mechanical engineering and has worked at SwRI since 1986 on various flow related projects. Among these projects was the construction and commissioning of key components of the Metering Research Facility starting in 1991. He has worked with many different meter types and conducted research concerning ultrasonic flow meter performance and coriolis flow measurement and contributed to the development of AGA Reports 9 and 11 covering those technologies. He is responsible for the flow measurement program at SwRI which includes operation of the Metering Research Facility and the Multiphase Flow Facility.
Bibliography
Lansing, J., Operational Issues with Ultrasonic Gas Flowmeters, CGA Gas Measurement School, Winnipeg, Manitoba, 2001.
Witte, J., Ultrasonic Gas Meters from Flow Lab to Field: A Case Study, American Gas Association, Operations Conference Proceedings, May 2002.
Wilsack, R., and J. Stuart, Re-Calibration of a 3-Year Old, Dirty, Ultrasonic Meter, American Gas Association, Operations Conference Proceedings, April 2001.
Park, J. T., Behring II, K. A., and T. A. Grimley (Southwest Research Institute), Uncertainty Estimates for the Gravimetric Primary Flow Standards of the MRF, Third International Symposium on Fluid Flow Measurement, San Antonio, Texas, April 1995.
American Gas Association, Compressibility of Natural Gas and Other Related Hydrocarbon Gases, AGA Transmission Measurement Committee Report No. 8, American Gas Association, Washington, DC, 1985.

Comments