Digital Technology Revolutionizes Gas Metering and Pipeline Monitoring
PAUL STOCKWELL, Managing Director, Process Vision
(P&GJ) — For more than 50 yrs, hydrocarbon dewpoint (HCDP) calculations have been the accepted standard for declaring natural gas “dry.” This method—combining pressure, temperature and composition into an equation of state—has been fundamental to contracts, tariffs and safety cases. By ensuring the HCDP is well below expected operating temperatures, operators have sought to guarantee that gas remains in single-phase as it travels from the source to point of use.
Now, advances in process camera technology allow engineers to see high-pressure gas flows in real time. This direct observation is having a significant impact on the industry and opens new opportunities, confirming whether gas streams are genuinely dry. More deployments are showing that, in some cases, hydrocarbon liquids are present even when HCDP values suggest a comfortable margin between actual temperature and the dewpoint temperature.
For suppliers and receivers, this visibility presents a chance to significantly improve commercial outcomes:
- Suppliers: For gas suppliers, detecting and managing condensate carryover means maximizing revenue by ensuring valuable natural gas liquids (NGLs) are recovered and sold rather than passing through custody meters unnoticed. Even a small liquid volume fraction of just 0.1% in a 100 million square feet per day (MMft3d) export line at 1,000 psi can equate to more than 748 gallons per day (gpd) of NGLs for purchase. At a conservative $51.3/bbl, that’s over $5.6 MM/yr in potential revenue.
- Receivers: For gas receivers, early identification of liquids in the gas stream reduces downstream maintenance costs, mitigates corrosion and erosion risks, and optimizes pigging schedules. Avoiding unnecessary pig runs (often ~$35,000/mile) and unplanned compressor servicing directly protects the bottom line by $MM/yr, while improving operational reliability.
The ability to see what’s flowing offers a win-win: greater profitability, enhanced safety margins and better-informed operational decisions for both parties. This article explores how the direct observation of gas flows complements traditional HCDP analysis, why the two can differ and how integrating both can unlock new levels of performance and profitability in natural gas operations.
HCDP calculation. While HCDP is used widely across the natural gas industry there have been several research papers warning of its limitations, including recent comparisons of six accepted calculation methods on a typical sales gas composition producing a reported HCDP temperature spread of 186°F (103°C). These equations use a different approach to characterize the heavier hydrocarbons (C6+) found in natural gas.
The divergence simply reminds us that phase envelopes are extremely sensitive to small changes in these heavier compounds that lie outside the routine analysis. When the author’s company’s process cameraa was introduced to observe activities inside live gas pipelines, it provided certainty regarding the phases present in the pipe. The presence of liquids in either mist flow or stratified flow is frequently observed while the reported HCDP is, for example, 40°F (–40°C). Initial thoughts might be that these observed liquids are not condensate but glycol or compressor oil.
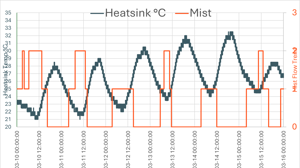
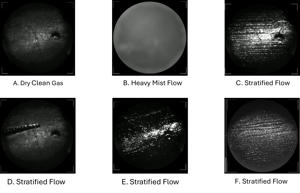
FIG. 1 shows the common liquid flow regimes observed by global system installationsa. While small amounts of glycol and compressor oil may be present, mist flows are frequently seen to vaporize as the pipeline temperature slightly increases and return when the pipeline temperature drops (FIG. 2). Observations of this flow could be described as the fundamental definition of HCDP.

Gas/liquid equilibrium. Comparing observations of liquid onset events with HCDP brings a second level of uncertainty. FIG. 3 shows one example the onset of a liquid event known to be condensate where HCDP did not react to the presence of volatile liquid hydrocarbons. While this explains how NGLs are getting into pipeline networks without tripping alarms, it raises concerns over the flow dynamics involved.

Why—with multiple examples in real world conditions—does HCDP not respond with the onset of liquids observed with process camerasa? Even if the calibration of the measurement or calculation was an error, one would expect to see a change when liquids appeared or disappeared. It leads to the question: When gas is flowing in a pipeline over a slower flowing liquid, are the gas phase and liquid phase in equilibrium?
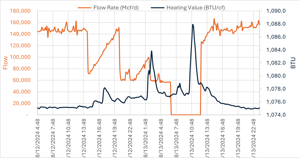
Oftentimes, it is when unusual things happen that we understand the mechanisms involved. FIG. 4 shows the British thermal unit (Btu) increase when gas flow stopped for a few hours. Why is this the case, despite the only change being that the flow stopped? The process cameraa showed a liquid stratified flow present and the gas chromatograph (GC) data showed that the C6+ element increased by 84% compared to the reading with the gas flow present.
One explanation is, with the gas flow stopped, volatile liquids have time to vaporize and come into equilibrium with the gas phase. They are then picked up by the GC monitoring gas phase components.

Sampling systems. Anyone who works with gas analyzers knows that liquids cause problems. The American Petroleum Institute (API) 14.1 and International Organization for Standardization (ISO) 10715 sampling systems deliberately avoids liquids on the pipe floor by sampling the middle of the pipeline diameter and filtering out droplets to protect analyzers. The job of the sample system is to provide a representative gas sample from the pipeline. However, this means that any stratified flow is missed, and any mist flow is rejected before it reaches the analyzer or sample bottle; therefore, engineers only receive a gas phase analysis. At this point, the sample has already been stripped of the liquids that increase the Btu and can lead to corrosion, erosion and catastrophic failure to:
- Compressors
- Pipelines
- Valves
- Regulators.
Gas turbine power station customers later struggle with blocked burner nozzles and holes in the turbine blades caused by hot condensate. This leads to uneven combustion and an unbalanced turbine that accelerates maintenance and increases the threat of catastrophic failure.
Visual confirmation is no longer a “nice-to-have”, but a direct way to close a costly accounting gap, safeguard high-value equipment and meet the asset integrity requirements of the Association of Mechanical Engineers (ASME) B31.8S-2022. Where HCDP alone can leave blind spots, real-time observation ensures operators know exactly what’s moving through their pipelines, enabling better decisions, higher profitability and compliance with integrity management programs.
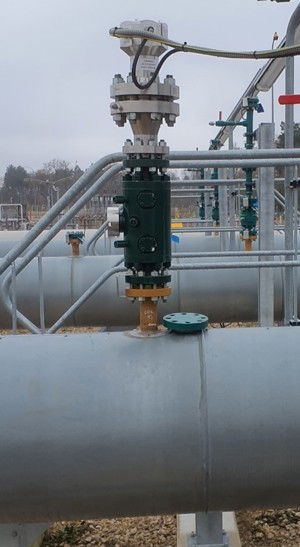
Process camera hardware. The cameraa is housed in a rugged stainless-steel enclosure, patented and certified for hazardous areas to Underwriters Laboratories/Canadian Standards Association (UL/CSA) Class 1 Div 1 and equipment for potentially explosive atmospheres (ATEX) Zone 1. It connects to any available 1" (or larger) tapping point via threaded or flanged connection and is typically installed with an isolation valve for safe, controlled access (FIG. 5).
One North American transmission operator reported a 3-hr window from the start of installation to capturing the first images—with no interruption to gas flow. Most pipeline networks already have the required tie-in points in place, enabling rapid deployment. Process cameraa discovery kits can be rotated between sites for 4-week survey periods, enabling engineers to monitor separators, compressor inlets or other key locations before committing to permanent installations.
DO I HAVE LIQUIDS IN MY GAS?
While process camera videos provide indisputable confirmation of liquid carryover, there are practical indicators operators can check that may suggest liquids are present even before deploying a camera:
- Review supervisory control and data acquisition (SCADA) trends during a planned or unplanned flow stoppage of 30 minutes or more. If the Btu value rises noticeably when the flow has been stopped for a while, it can indicate heavier hydrocarbons have condensed in the line and are evaporating into gas phase.
- Check HCDP data for the same flow-stop period. An increase in reported HCDP (e.g., –40°F to –35°F) can point to liquids vaporizing while the gas was stationary.
- Take a sample from a low-point drain during a no-flow condition. Liquids may not appear during normal flow due to the Venturi effect at the tapping point but can accumulate on the pipe wall and drop to the bottom once flow stops. Open the drain slowly—if the valve is opened abruptly, the pressure drop can cause rapid vaporization into mist. If possible, capture this on video.
If any of these conditions are observed, it suggests that liquids may be present either continuously or intermittently. A short-term process cameraa study on an existing tapping point can then provide conclusive evidence, indicate the severity and support decisions on mitigation.
Processing and cloud analytics. Variations in brightness and texture on video frames translate into qualitative indices for mist density and pipe wall coverage. Still shots are uploaded once a minute and sent through a secure and encrypted link to a portal. A machine learning (ML) model, trained on millions of tagged frames, classifies conditions: clear gas, light and heavy mist, and distributed and stratified liquid flow.
During studies, additional SCADA data—gas flow, process pressure, multi-train differential pressure and more—can be correlated with the image meta data in a second ML model that cross plots process variables against image data for causation dependencies. Operators at one gas processing plant discovered that liquid levels in the separator and the differential pressure between two trains were the main drivers of the present mist flow. Closer control of liquid levels can deliver a quick win when cause and effect can be demonstrated in this way.
Software maintenance is as seamless as updating a smartphone app. Firmware upgrades, security patches and algorithm improvements download automatically in the background. From a single browser tab, one engineer can now scroll through color-coded heat maps of liquid events for all their facilities.
Complementing traditional measurements. HCDP monitors, GCs, moisture analyzers and hydrogen sulfide (H2S) analyzers remain essential tools in gas quality measurement. Process cameras do not replace these instruments but enhances their value by validating the critical assumption behind the readings that the gas stream is in single-phase flow.
When video confirms that no liquids are present, operators can trust their existing measurement data with greater confidence. When mist or stratified flow is detected, the same images prompt timely remedial action and flag the need to treat flow measurements and gas analysis with heightened caution due to the presence of wet gas.
A U.S.-based midstream operator uses a process camera as an additional gas quality check at custody transfer points, while a Middle Eastern operator deploys it at compressor inlets to safeguard equipment. In both cases, the process camera integrates seamlessly with established measurement systems, improving gas quality management, protecting assets and reducing costs for all stakeholders.
PRACTICAL ADVANTAGES
Gas processing trains. Live footage enables operators to balance parallel separators and run closer to optimum throughput. With tighter control on liquid carryover at the front end of gas processing, plants previously limited by fear of foaming can boost production by several percentage points of capacity because they can now watch for liquid breakthroughs.
When the process camera is installed on the export gas line, improved NGL recovery can be implemented and demonstrated, increasing the plant’s condensate revenue stream.
Custody transfer metering. A pipeline operator used video evidence of stratified NGLs to escalate a gas quality problem with a gas supplier. The dispute was quickly resolved with footage from a process camera system on the supplier side showing that the liquid event was transient and on the supply side, preventing a valve closure or other action by the pipeline operator.
Compressor stations. Early detection and prevention of liquids in either mist or stratified flow can extend the average dry-gas seal life from roughly 1 yr to more than 3 yrs in a natural gas compressor, significantly decreasing unplanned outages, servicing costs and seal-gas consumption. With liquids often being present at start-up, live footage can be used to hold off ramp-up until the liquids have moved through the compressor. Risks can be better evaluated for personal safety and compressor trips or worse can be prevented.
Power stations. By the time natural gas reaches a turbine power station, it may carry unwanted contaminants, including liquids from upstream suppliers, compressor oil carryover and iron sulfide from pipe walls. If not effectively removed, these can cause significant damage. Process camera footage taken downstream of filter packs has revealed filter breakthrough under varying operating conditions—a problem that differential pressure (dP) readings can miss, since it shows what the filter has already stopped.
With better visibility of what passes through, operators can fine tune inlet gas heater control, preventing fuel nozzle blockages and reducing hot-spot formation, ultimately improving turbine performance and reliability.
Liquified natural gas (LNG) feed gas. One study showed that just 3 parts per billion (ppb) of heavy hydrocarbons (C12+) is sufficient to block a cold box in just 30 days. With many LNG plants having multiple supply lines, knowing which these supplies are delivering liquids is vital for continued, uninterrupted LNG production, and to ensure sufficient and effective filtration and separation systems continue to perform throughout their design life.
Compromised systems. Asset integrity management programs, aligned with ASME B31.8S-2002, can use liquid carryover detection to identify heightened risks for feedback into mitigation actions to compressors and other critical infrastructure. Stratified flows often transport electrically conductive solids that can bridge isolating joints, weakening or bypassing cathodic protection systems. This increases the likelihood of corrosion and creates a slow, often unnoticed, pathway for methane release.
Early detection enables integrity teams to intervene with targeted pigging before the issue escalates into a reportable incident, helping operators protect infrastructure, maintain compliance and meet methane intensity reduction commitments demanded by global investors and regulators.
Broader perspective. Cameras, analytics and cloud-based reporting may sound innovative, but they follow the same trajectory already well established in other industries, such as predictive maintenance on rotating machinery, satellite monitoring of pipeline corridors and drone inspections of flare stacks. Process cameras apply the digital transformation to process control, much like closed-circuit television transformed the security industry.
What sets the process cameraa apart is its ability to connect directly to existing tapping points with minimal installation effort, while producing a small data footprint. Cybersecurity—often a concern with cloud-connected systems—has been built in from the start, with secure global access, remote software updates and continuous system health monitoring, ensuring operational resilience and data protection.
Takeaway. Flowmeters, GCs, moisture sensors and H₂S analyzers remain essential to gas commerce and safety, but they cannot capture every transient event experienced by modern pipelines. High-resolution cameras, combined with embedded and cloud-based ML, add the missing layer of direct evidence. These systems do not replace traditional tools but make them more reliable by verifying the single-phase flow assumption on which their accuracy depends.
With simple retrofit hardware, rapid installation and minimal bandwidth requirements, the barrier for adoption is low. However, the benefits are significant: recovered liquids, extended equipment life, reduced maintenance costs and improved environmental, social and governance performance. When operators can see the gas stream instead of merely inferring its condition, situational awareness improves, decisions are faster, disputes are diminished and margins grow.
Digitalization in gas operations is no longer a buzzword, it is a practical, proven pathway to a more resilient, transparent and profitable gas value chain, combining the precision of calculated science with the undeniable clarity of direct observation.
NOTE
a Process Vision’s LineVu process camera


