
October 2022, Vol. 249, No. 10
Features
Case Study: Inspection of Indonesian Pipeline Infrastructure
By Andy Noorsaman, Nuramzan Iftari, Riezqa Andika and Reviana Revitasari, Chemical Engineering Department, Universitas Indonesia
(P&GJ) — The natural gas transmission pipeline is critical to national energy security. To prevent future process faults and to guarantee safe and continuous operation, it is essential to identify risk and forecast future equipment failure and its effects.
To avoid equipment breakdowns and maintain the integrity of assets, inspection has been used to ensure that all the equipment in the production and processing plant is suitable for service.
When the risk is identified, inspection and mitigation actions need to be positive for reducing risk to an acceptable level. However, it is not practical to do a full, thorough inspection of all the equipment in a manufacturing and processing plant because of the complexity and number of the equipment.
To determine the appropriate inspection method that may effectively and efficiently boost the production and processing facility’s safety and dependability, risk-based inspection (RBI) is usually conducted. RBI focuses on inspections based on the equipment’s risk of failure (RoF), enabling companies to concentrate inspection resources on equipment with a high RoF.
RBI offers a broad framework for risk assessment and assists in creating connections between failure modes and related damage mechanisms. It also helps predict results generated from the probability of failure (PoF) and the consequences of failure (CoF), which then can be used for operational risk evaluation activities.
Based on the factors that affect the equipment’s failure rate, such as the kind of degradation mechanism, the pace of deterioration, the operational environment, the equipment design, the effectiveness and outcomes of past inspections, and the age of the equipment, PoF is assessed.
Degradation mechanisms in risk assessment include general/localized thinning, stress corrosion cracking, corrosion under insulation, brittle fracture, embrittlement and fatigue. Based on the variables that affect the severity of risks in the case of a hydrocarbon release, such as the substance type contained in the equipment and process conditions, CoF is calculated.
To illustrate risk assessment outcomes, the PoF and CoF assessment results are then integrated and expressed in a risk matrix. If inspection activities do not successfully lower the equipment RoF, risk mitigation measures are necessary. Subsequently, a reassessment should be done to determine the new risk profile (Figure 1).

Despite its numerous benefits to the overall risk assessment and inspection (RAI) process, screening evaluation has qualitative qualities that make it susceptible to human biases and inaccuracies. Because assessment is subjective and there is a finite amount of data and information, results from one assessor and those from other assessors may differ.
It may result in an excessive amount of examination for lower-risk equipment and a lack of inspection for higher-risk equipment. Additionally, qualitative analysis is thought to take a lot of time and effort.
Binary classification issues can be resolved using big data and a variety of machine learning techniques. Some applications that have been used include the use of binary logistic regression to prioritize inspections and maintenance schedules based on the condition of transmission gas pipelines.
The classification model to replace manual corrosion matching activities can be time-consuming, labor-intensive, and prone to errors, and the best accuracy in failure risk prediction.
This article discusses how to determine risk prediction from big data of onshore gas transmission, compares the effectiveness of the intelligent system and the conventional assessment and discusses the best inspection program based on the results of the risk assessment to optimize the inspection plan and reduce losses.
Research Methods
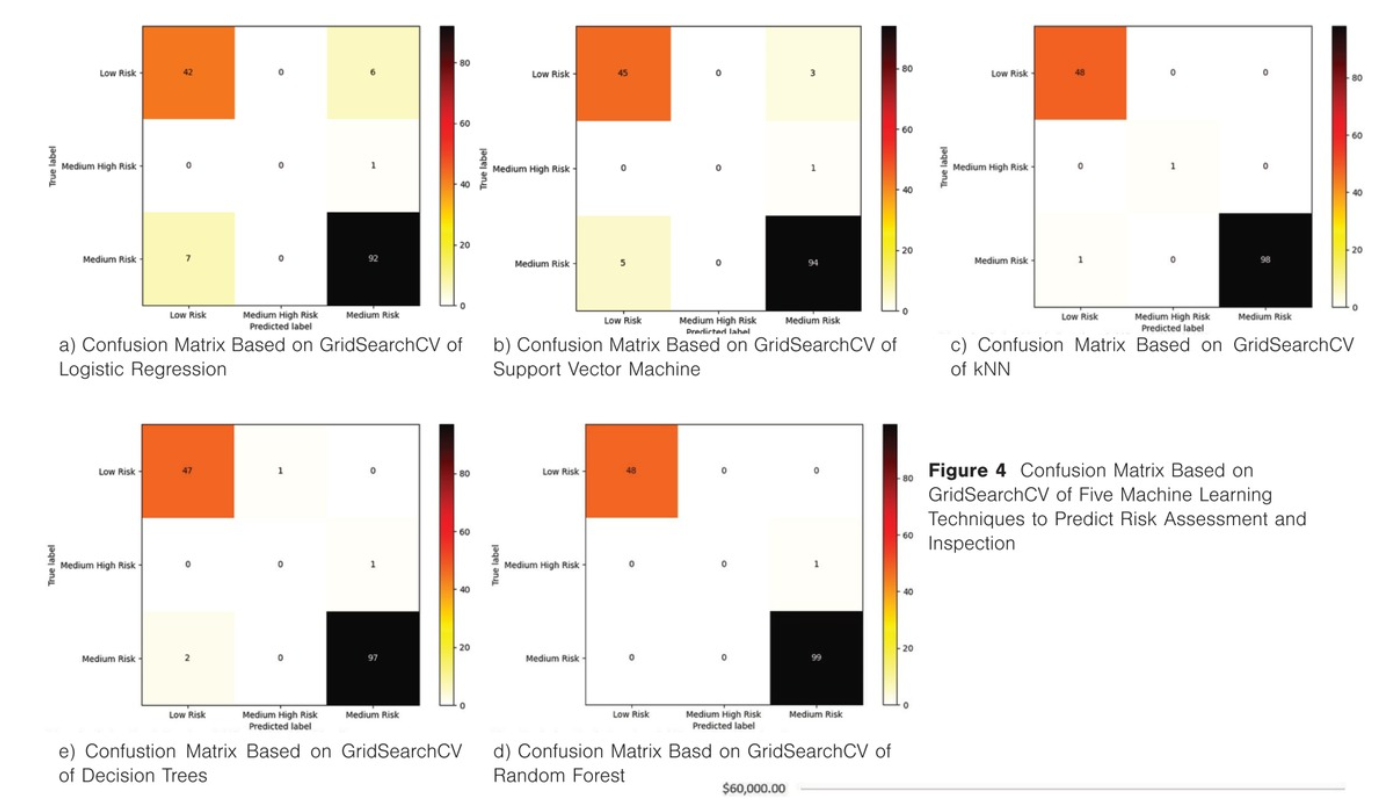
The algorithm that produces the best results is chosen after a set of binary classification techniques are chosen and evaluated against one another. Five established classifiers are selected, such as logistic regression (LR), support vector machines (SVM), k-nearest neighbors (k-NN), random forests (RF) and decision tree (DT).
The following iterative stages are used to create machine learning models – relevant data are gathered and preprocessed, the model is trained using numerical optimization, and the outcomes are validated. Before a viable model is identified, each step—data collection, preprocessing and training—might need to be performed and adjusted numerous times. Once a model is sufficiently developed, it can be put into use where it will be continuously validated and refined as new data become available.
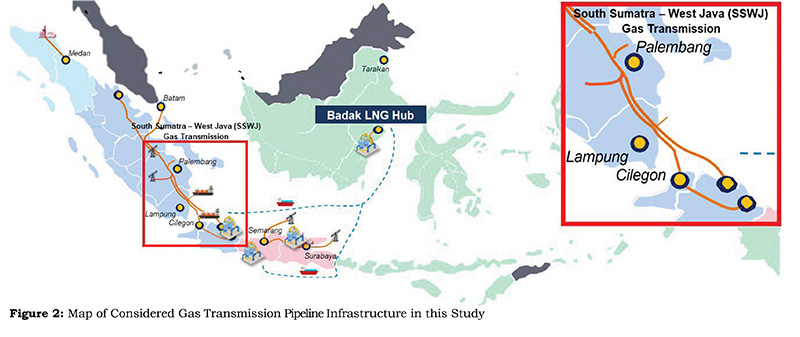
The big data obtained from the RAI conducted on the gas transmission infrastructure (Figure 2) is managed by a state-owned enterprise in Indonesia and comprises more than 354 pipes, 19 filters, 23 vessels, 7 pig launchers, 7 pig receivers, 1 slug catcher and 1 sump tank. The data set contained a total of 737 instances.
Results of the comparative analysis of machine learning techniques to predict RAI are as follows.
GridSearchCV analysis is carried out to increase the accuracy of the machine learning model for the best hyperparameter results. The chosen solver is lbfgs (Limited-memory Broyden-Fletcher-Goldfarb-Shanno) for logistic regression. The chosen kernel is rbf for SVM. A comparative analysis is performed between the output of the system intelligence with conventional assessment as follows.
Based on the results of the comparative analysis in the previous section, the best-performed model of machine learning is random forest.
In Figure 4, the inspection cost for activities that are not risk-based has a trend line to decrease at the end of the period in the sense that the inspection cost at the beginning of the period is higher than at the end of the period.
Conversely, the inspection cost for activity-based risk tends to increase at the end of the period in the sense that the inspection cost at the beginning of the period is lower than at the end of the period.

Comments