
March 2022, Vol. 249, No. 3
Features
Non-Intrusive Method Using Induced Pressure Waves to Track Moving Objects Within Pipelines
By Stephen Newman, Halliburton, and Graham Jack, Halliburton
November 2019 saw the dawn of a new era in real-time pig tracking when Halliburton Pipeline and Process Services successfully validated a live pig-tracking method based on patented transient wave theory, the foundation of their InnerVue suite of services.
A negative pulse InnerVue survey is best described as being similar to a sonar response technique. A controlled hydrodynamic wave is induced into a pressurized pipeline system, and the position of a significant flow impairment can be determined by identifying reflexes visible in the recorded data trace. This method is suitable for use in both fluid and gas systems, though the analytical approach for either is very different.
With a focus on this application in gas systems, it is imperative that the acoustic velocity of the medium being transported in the pipeline is known as accurately as possible. Largely based on ideal gas theory and adiabatic propagation, unrestrained acoustic velocity is calculated and thereafter extrapolated into a restrained velocity profile specific to the pipeline.
Characteristics are adjusted to reflect the operating parameters of the pipeline at the time of surveying; flow, pressure and temperature all impact the density and compressibility of the gas. This has a direct effect on relative bulk modulus and the equivalent speed of sound at any given point in the system, which in addition to the considerations taken toward the specific shape of the wave generated, render the transit of any pulse within the pipeline as unique.
In 2019, Halliburton Pipeline and Process Services successfully executed an extensive pipeline precommissioning campaign in eastern Europe. During the proceedings, a lost-pig occurrence prevented completion of the dewatering workscope of one of the 18-inch pipelines. Halliburton Pipeline and Process Services carried out a survey to locate the lost pig. The successfully deployed survey provided critical information necessary to develop a pig recovery plan and the lost pig was located 10.3 miles (16.5 km) from the platform.
Working closely with engineering, procurement and construction (EPC) and field operators, a reverse pigging operation, involving Halliburton managing a combination of specialist services onshore, offshore and remote deepwater, was conducted to recover the pig.
A foam pig was launched from a deepwater pig launcher and traveled toward the platform. The propellant was nitrogen gas supplied from a membrane spread transferring the nitrogen gas via twin gathering pipelines. A crossover at the subsea manifold presented a serious challenge to accurately locate the pig, which traditional methods were not able to overcome.
Pig-tracking specific InnerVue surveying was performed on board the production platform throughout the reverse pigging operations. In live conditions, pressure waves were transmitted through the system in real time, allowing live monitoring of the now-found pig location. Once the foam pig reached this location, both pigs in unison began moving toward the platform. Surveying continued throughout and provided a real-time location, speed and estimated time of arrival.
The next phase of live pig-tracking development is underway. It focuses on a commercialized practical solution deployable as an integrated offering with the flexibility to enhance pigging operations no matter the scenario or stage of asset life.
Theory
This section provides explanation of the theory behind the use of pressure wave monitoring. To track objects, it is key that the acoustic velocity of the medium being transported in the pipeline be known as accurately as possible.
To calculate the acoustic velocity of the pipeline contents, the following factors must be known: pipeline internal diameter (mm), pipeline wall thickness (mm), Young’s modulus (Pa), fluid density (kg/m3), fluid bulk modulus (Pa), and fluid viscosity (cP). The fluid characteristics need to be adjusted to reflect the operating parameters of the pipeline, because flow, pressure and temperature can all impact the density of a fluid, which affects the bulk modulus.
From these characteristics, acoustic velocity in an unrestrained fluid (relative speed of sound) can be calculated, theoretically using the Newton-Laplace equation according to Rowlinson and Swinton (1982) and shown in Equation 1.
Once this unrestrained acoustic velocity is known, a modified hooks law formula according to Chilingarian, Robertson and Kumar (1987) and shown in Equation 2 can be used to combine it with the pipeline characteristics to define the restrained acoustic velocity.
Object tracking is predicated on the premise that if the velocity of the pressure wave traveling in the pipeline is known and the time it takes to traverse the pipeline to the object can be recorded, then the location of the object can be determined according to Bird (2015), using Equation 3.
Objects can be tracked by repeatedly introducing pressure waves into the pipeline and monitoring for the response wave. Object velocity can be monitored by introducing pressure waves at set intervals. Calculating distance traveled over a given time interval allows calculation of average object velocity and, subsequently, pig estimated arrival time.
Data Collection
There are two requisites for data collection for analysis – a pressure wave can be generated within the pipeline and there is a tie-in point for the data to be recorded. A data logger is connected to the pipeline at a point close to the pressure pulse generation point to record the changes in pipeline pressure caused by the pressure wave reflecting from objects in the pipeline.
The use of an ultrahigh-speed data logger recording at an equivalent 4,000 data points per second (dps) with a sensitivity of 0.15 percent ensures that a high level of accuracy can be achieved, a reasonable indication of which would be one data point being referenced every 9.84 inches (250 mm) along the length of the system.
When the object-tracking operation is ready to perform, the data logger is set to record the pipeline pressure. A pressure wave can then be generated, and the pressure variations are monitored and recorded (Figure 1).
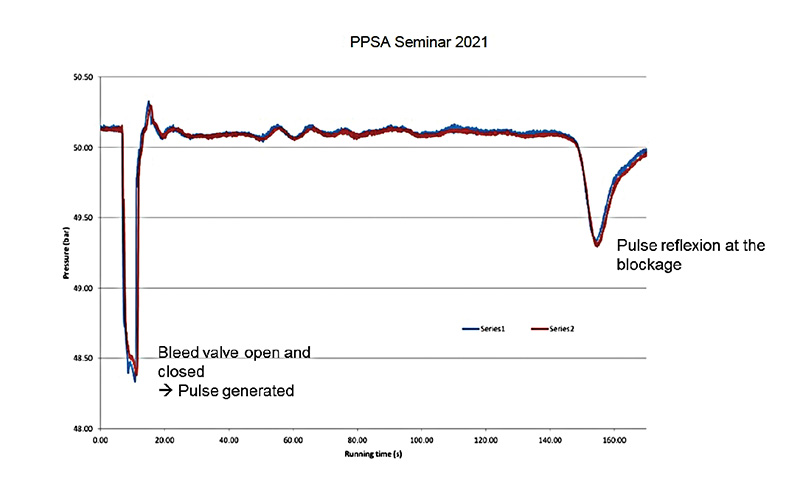
Figure 1 shows a pressure wave being created at approximately 10 seconds. A reflex from this pressure wave is clearly seen at approximately 155 seconds.
Pressure waves can be produced at set intervals to allow real-time tracking. Data can be captured on the data recorder and automatically processed with real-time location, object velocity and estimated time of arrival live-streamed to a web portal or similar.
In situations in which there is low confidence in the known fluid parameters and, therefore, the theoretical acoustic velocity, a calibration measurement may be possible if a system containing the same fluid is available. This could be the system to be surveyed if it contains a feature, such as a tee, which can be identified on the pressure trace. A measurement taken from this system will allow calculation of an accurate acoustic velocity using the equations detailed above.
Pulse Generation
To generate the pressure wave, a mechanism needs to be in place to allow the generation of a pressure pulse by bleeding off a small volume of fluid from the pipeline. This could be from the rapid opening and closing of a bleed valve with pipework routed to a safe vent location (Figure 2).
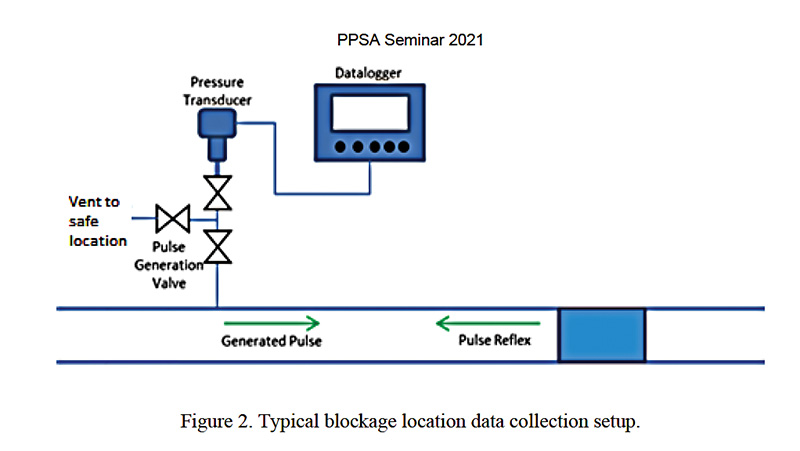
The pulse generation valve can be a manual valve operated by personnel or an automated actuated valve. With an automated valve, pressure waves can be produced at known intervals allowing continuous monitoring of object location.
Analysis
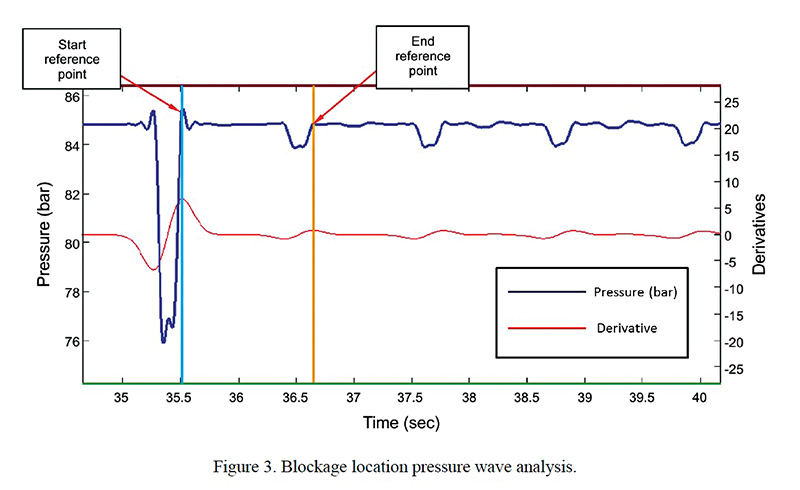
The data sets are analyzed using proprietary software to identify the pulse generation point and reflex.
A number of reflexes are often seen when tracking objects. Only the first reflex is used in object-tracking calculations. Reflexes after the initial end reference point are caused by the pressure waves bouncing back and forth along the pipeline between the object and pulse generation points.
For object tracking, the time difference between the start reference point and end reference point (Figure 3) can then be used with the acoustic velocity calculated in Equation 2 to determine the distance to the blockage using Equation 3.
Case Study
There was an urgent need to locate a stuck commissioning pig in a new build pipeline in the Mediterranean Sea. A remotely operated vehicle (ROV) survey to locate the pig was not practical. A non-intrusive survey was suggested because this would quickly and effectively locate the pig with minimal effort and no intervention required within the main pipeline. A non-intrusive pressure wave survey offered the lowest risk and quickest option to locate the blockage and track recovery of the pig.
Nitrogen gas propelled the pre-commissioning pig. From Equation 1 the acoustic velocity of nitrogen at the operating conditions was found to be 781 miles per hour (349 meters per second). Understanding the acoustic velocity would allow locating and tracking of the pig though pressure wave analysis.
After setting up the temporary InnerVue equipment to record and induce pressure waves, a number of pressure waves were introduced into the pipeline behind the stuck commissioning pig. Figure 4 shows the average pressure wave response from the surveys.

The initial pressure wave recording shows the pressure wave being created at 3 seconds and then a large reflex at 100.1 seconds, followed by a much smaller reflex at 197.2 seconds. The time between the first and second reflexes is consistent at 97.1 seconds. This shows a strong initial pulse wave and response followed by a further response as the pressure wave travels back out to the pig and returns to the data recorder.
The pressure wave response time and acoustic velocity can be used to determine the location of the object in the pipeline, in this case the stuck commissioning pig. Equation 4 was used to confirm that the location of the pig was at 10.25 miles (16,500 meters).
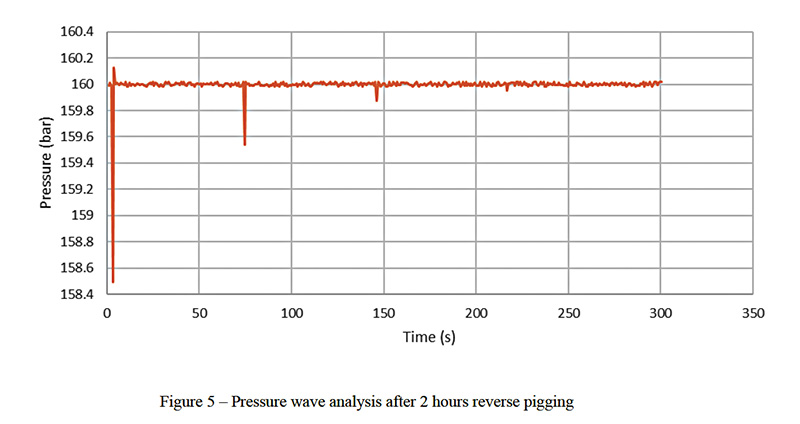
In the instance the blockage location was known, a remediation plan was put together. It was decided to drive the pig back to the pig launcher using a foam pig. During reverse pigging, pressure wave analysis was performed at short intervals to confirm pig average velocity, pig location and estimate pig arrival time back at the pig launcher. Figure 5 shows a sample data set taken after two hours of reverse pigging operation.
The pressure wave analysis shows a response time at 74.2 seconds. The pressure wave was created at 3 seconds, which gives a pressure wave transit time of 71.2 seconds. The new pig location from Equation 4 is 7.52 miles (12,100 meters) from the survey point. The pig had transited approximately 2.73 miles (4,400 meters) with a pig velocity of 1.3 miles per hour (0.6 meters per second). The estimated time of arrival was calculated at 5.6 hours.
Further pressure wave analysis was performed at regular intervals until the pig was received back at the pig launcher. The acoustic velocity was updated as the surveys progressed and the operating parameters of the pipeline changed. The pressure wave analysis allowed continuous tracking through the recovery operations.
Conclusion
The theoretical models behind the methodology are validated by proven results in actual pipelines, showing an acute level of accuracy when locating pipeline blockages and tracking moving objects. In addition, the pressure wave analysis removes the risk of inserting tools into the pipeline or investing in costly onshore excavations or offshore vessel-based ROV surveys.
Pressure wave analysis has been shown to be an effective method for locating, tracking and monitoring movement of pigs and potentially any object within a pipeline. The method offers reduced cost and reduced risk when compared to traditional methods with pig signalers or otherwise.
Locating and tracking can be performed using pressure wave analysis at any point in a pipeline with very little intervention required. The technology offers a cost-effective, low-risk option for tracking objects.
Editor’s note: This paper was first presented at the November 2021 Pigging Products & Services Association Seminar.

Comments