
April 2022, Vol. 249, No. 4
Features
Using Motion Cameras to Evaluate Flow-Induced Vibration
By Meshal Alsaiari, Bander Al Otaibi, and Carlos Herrera Sierralta, Saudi Aramco, Kingdom of Saudi Arabia
Piping vibration issues is an area of concern for the oil and gas industry, because it may cause severe plant production interruptions, impact plant integrity, compromise workers safety and/or impact the environment.
Vibrating equipment and process components raise stress concentration at the joining parts, such as welding and flange connections. According to the Energy Institute (EI) Guidelines, piping vibration causes mechanical excitation, pulsation and flow-induced turbulence.7
Excessive piping vibration dramatically influences hydrocarbon and utilities transportation since vibration could result in ruptures and massive impact on production.1-6 Flow-induced vibration is one of the common piping vibration phenomena initiated by different flow behaviors: turbulence, slug, two-phase flow, acoustic vibration and pressure fluctuation.5,8 These fluctuating flow patterns can act on the piping branches and result in severe failures.5
Process piping system mainly entails two vibration initiation sources: the process flow and the mechanical structure system that includes piping, supports, valves and other static components.9
To prevent the safety risks associated with loss of pressure containment and the financial impact of loss of production, piping vibration issues must be properly identified and addressed. The paper is organized as follows. Section 2 reviews the specific case of study, illustrates the vibration problem experienced at the field, and provides the vibration readings data that reflect the “danger level” condition of the vibration.
Section 3 describes the methodology implemented in the solution of the problem in question and provides the steps required to implement the suggested approach. In Section 4, steps previously provided in Section 3, the methodology section, are described by explaining the objective of applying the dynamic energy quantitative assessment as provided by EI, which is Step 1 of the proposed methodology.
Case Study
This article presents a case of a recurrent vibration occurring in a gas compression unit fed by overhead gas received from oil stabilizing plants. The received sour gas is compressed because high-pressure compressed gas is better for the stripping process. The compression section has low- and high-pressure compressors. A single gas turbine with one shaft drives both centrifugal compressors.
The low-pressure section separates sour water from the incoming sour feed gas. It compresses the gas from atmospheric pressure to 170 psig (11.7 bar). The gas is then cooled to remove the heat caused by the compression process. The high-pressure section takes the gas from the low-pressure section. It extracts more sour water and further compresses the gas to 450 psig (31 bar).
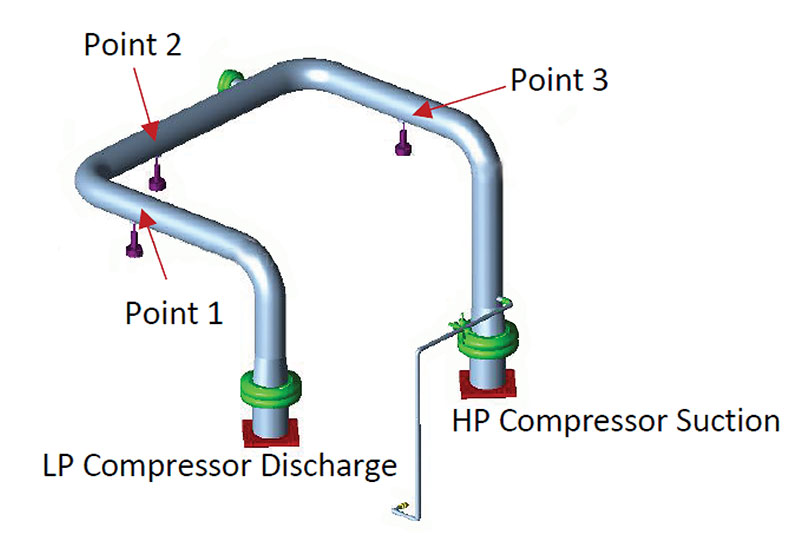
The gas is again cooled to remove the heat caused by the compression process. The vibration was present at the 20-inch (508-mm) piping section that connects low to high compressors. This gas compressor HP inlet line was experiencing chronic vibration for approximately 20 years.
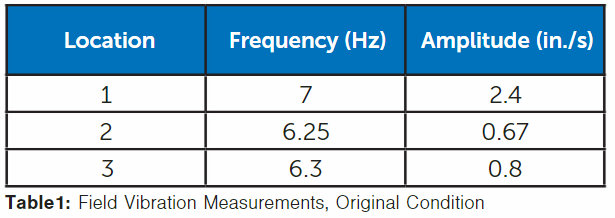
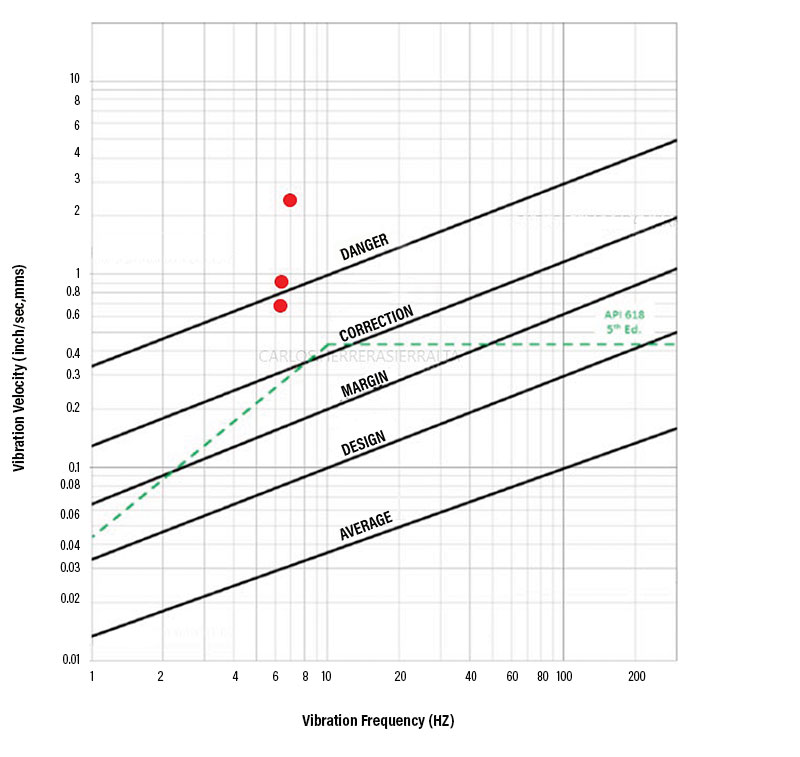
Table 1 shows the set of field measurements that were taken at three different locations of the line under study. Figure 1 shows the locations of the measurements.
Methodology
The motion amplification camera approach, which led to the solution of the vibration of the line under study, is described in the following steps:
Step 1: Dynamic Energy Quantitative Assessment – Based on the piping system in question according to Energy Institute Guidelines (Section 4), this step acts just as a screening criterion to detect whether the piping vibration issue at field (in case of flow-induced vibration) requires correction or not. Experience shows that likelihood of fatigue failure (LOF) classifications medium and high need to be corrected.
Step 2: Motion Amplification Camera (MAC) – Conduct the MAC survey and perform the analytical interpretation of the line vibration (Section 5).
Step 3: Piping Supports Assessment – Run the static model using piping flexibility analysis software to check the mechanical integrity of the line and compressor nozzle with the proposed modification (Section 6).
The last stage is to implement the recommended piping supports modifications at the field and confirm satisfactory results.
Dynamic Energy
All process-related parameters such as flow rate, density and velocity were collected to accurately calculate and evaluate the vibrating piping kinetic energy.
The dynamic energy quantitative assessment calculation was based on EI guidelines where the actual density is multiplied with the velocity squared for a single flow, as indicated in Equation 1.7 This equation output revealed that the affected piping has dynamic energy of 7,600 kg.m.s2.
The EI Guidelines categorized this dynamic energy level at the medium level likelihood of fatigue failure as illustrated in Table 2.7 Therefore, a piping modification was required to be analyzed and implemented to mitigate vibration.
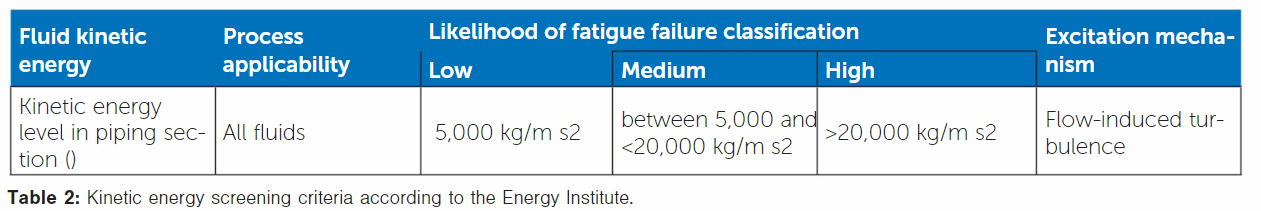
According to the screening criteria above, the LOF present in the line is “medium.” Therefore, experience shows that the piping vibration must be corrected by either modifying the process parameter involved or by modifying piping supports. Since in this case the process parameters cannot be modified without reducing plant production, the correction must come from a piping support perspective.
Motion Amplification
Recently, the motion amplification camera evolution has become a promising technique and grabbing significant attention across all industries. This technology aims to measure and visualize the vibration for any structures and machinery by developing a 3- to 5-second video clip.12
The recorded high-resolution/high-speed video processes each pixel as an accelerometer and uses the pixel’s light intensity intonation to determine the vibration displacement frequency range.13
Based on this principle, the microscopical vibration amplification makes possible the assessment of the resulting slow-motion video that can be observed to determine which are the real components (x, y, z) of the vibration present in this line.
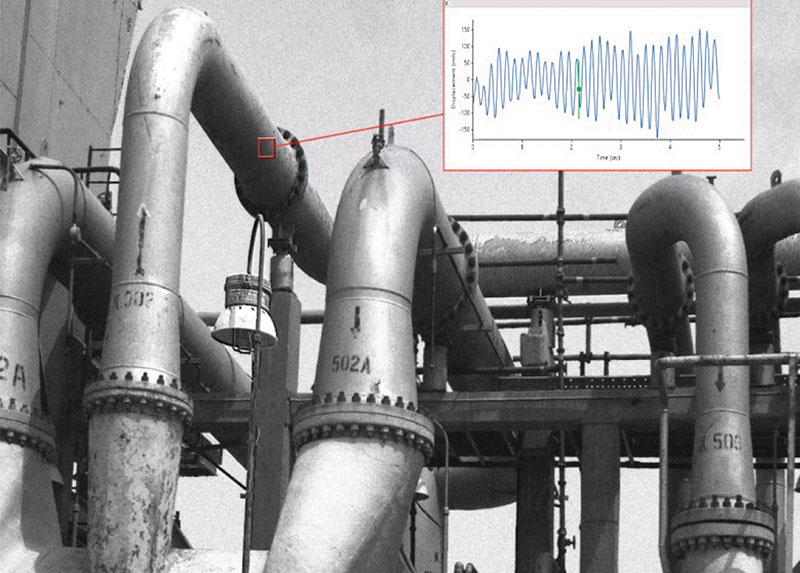
This was exceedingly difficult to determine by normal visual observation. In this case, the major component that provoked the vibration was observed in the z-axis (horizontal plane) and parallel to the compressor shaft near to the spring support location (Figure 3).
Our experience shows that slow-motion video interpretation can lead to determine the areas of the piping that are experiencing the highest vibration levels (amplitude) and help to break-down the vibration into the (x,y,z) components, which will lead to interpreting the vibration and subsequently proposing the necessary piping support modifications that may lead to controlling it.
Supports Assessment
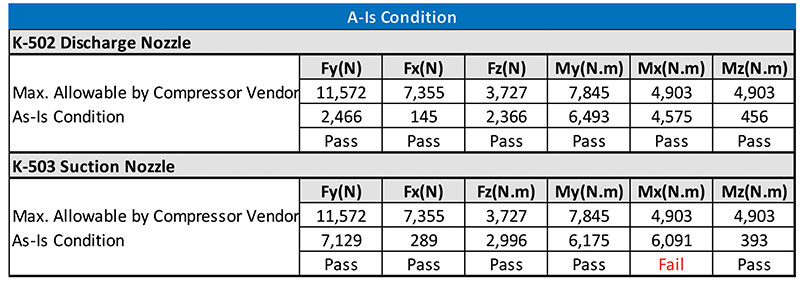
Based on as-built isometrics drawings and field observations, an “as-is” model was developed in the piping flexibility software CAESAR II. Results of the model assessment show that the existing piping support setup provokes an excess on the allowable moment at the HP compressor suction nozzle, with a ratio of 119.5% (6,091 N.m vs. 4,903 N.m) (Table 3).
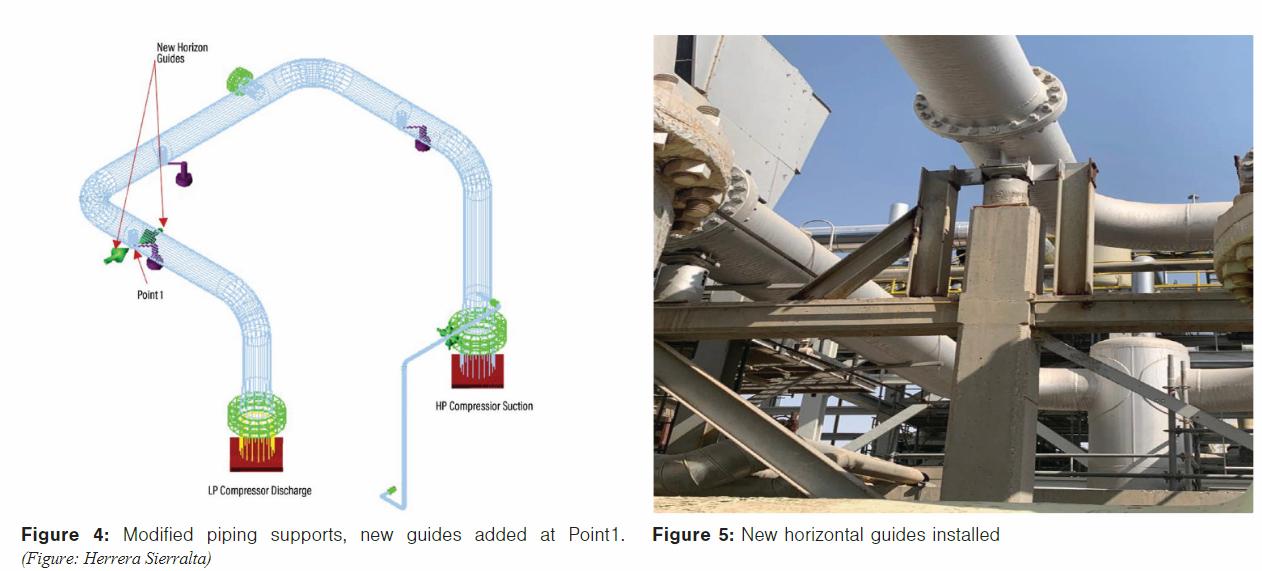
The addition of the guides support, as described in Figure 4 and Figure 5, made it possible to reduce the vibration level observed. At the same time, it reduced the calculated moment at the HP compressor suction nozzle below the recommendable level.
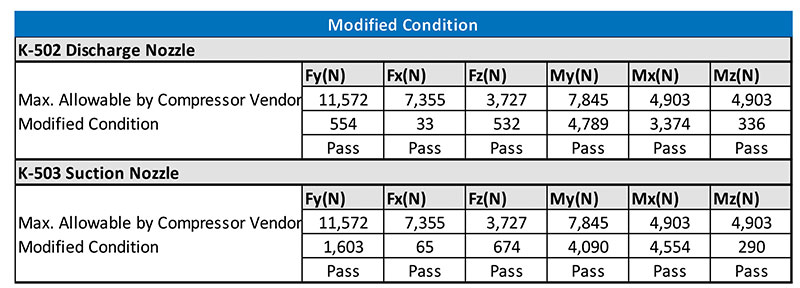
The model showed that by adding the guides, the loads and moments will be below the allowable loads and moments recommended by the compressor vendor (Table 4).
In addition, the dynamic analysis of the modified model shows that the model achieved a natural frequency of 3.63 Hertz, which is near 4 Hertz, as defined by IE as “medium” stiffness. Experience shows that this value is considered sufficient to handle flow-induced vibration issues such the one observed in the field.
Figure 5 shows the actual modification that was conducted at the spring location of Point 1 (adding horizontal guides).
Conclusion
The use of MAC technology based on microscopical amplification, and the visual interpretation of the piping movements in the slow-motion video, which result from MAC, can help the piping stress engineers to propose piping support modifications. That, in conjunction with the analysis of the stress model for checking stability and code compliance, the implementation of solutions to mitigate or eliminate piping vibration issues can be remarkably expedited.
The approach described helps to capture financial benefits from the reduction of engineering and, in most of the cases, help avoid plant shutdown and loss of production.
References:
[1] W. Group, “Piping Vibration and Integrity Assessment,” Pip. Vib. Integr. Assess. (2008).
[2] G.Y.H. Lee, K.B. Chan, A.Y.S. Lee, and S. Jia, “High Energy Vibration for Gas Piping,” IOP Conf. Ser. Mater. Sci. Eng. 217, 1 (2017), doi: 10.1088/1757-899X/217/1/012010.
[3] Y.H. Tyng, O.Z. Chao, K.K. Kuan, Z. Ismail, A.G. AbdulRahman, and C.W. Tong, “Similitude study of an in-service industrial piping system under high flow induced vibration,” J. Mech. Sci. Technol. 31, 8 (2017): p. 3705–3713, doi: 10.1007/s12206-017-0713-0.
[4] K.K. Kong, et al., “Failure analysis of flow-induced vibration problem of in-serviced duplex stainless steel piping system in oil and gas industry,” Mater. Res. Innov. 18 (2014): p. S6-417-S6-422, doi: 10.1179/1432891714Z.000000000990.
[5] M. Jaouhari and F. Self, “Differentiating Between Acoustic and Flow-Induced Vibration,” 2018.
[6] and S. A. R. I. V. Orynyak, A. S. Batura, “Application of the Method of Initial Parameters to Analysis of Coupled Hydromechanical Vibrations in Piping Systems. Part 1. Vibrodiagnostics of Piping Under Mechanical Vibrations,” Strength Mater. 43, 6 (2011): p. 628–636.
[7] L. Energy Institute, “Guidelines for the avoidance of vibration induced fatigue in process pipework,” Offshore Res. Focus 44, 131 (2001): p. 6.
[8] S. Saha, “A Random Vibration Approach for Fatigue Design of Industrial Piping,” Trans. Indian Inst. Met. 69, 2 (2016): p. 537–542, doi: 10.1007/s12666-015-0810-7.
[9] Y. Li, S. Han, J. Liu, J. Liu, and H. Du, “Vibration analysis and control for reciprocating compressor piping system,” Appl. Mech. Mater. 157-158 (2012): p. 930–934, doi: 10.4028/www.scientific.net/AMM.157-158.930.
[10] International Organization for Standardization, “Machine Vibration by Measurements on Non-rotating parts -,” Int. Organ., 1995.
[11] S. Li, L. Zhang, and C. Kong, “Vibration Failure Analysis and Countermeasures of the Inlet Pipelines at a Gas Compressor Station,” Shock Vib. 2019 (2019), doi: 10.1155/2019/6032962.
[12] P. E. Stephen M. Price, “A comparison of Operating Deflection Shape and Motion Amplification Video Techniques for Vibration Analysis,” 48th Turbomach. 35th Int. Pump Users Symp., vol. 53, no. 9, 2019, p. 1689–1699.
[13] M. M. O. William, Marscher P.E, “Video Motion Amplification vs. Operating Deflection Shapes for Machinery Diagnosis,” Intell. Technol. Equip. Hum. Perform. Monit. Proc. MFPT 2018 (2018).
[15] EDI Report 85-305, Engineering Dynamics Incorporated, Vibration in Reciprocating Machinery and Piping System, EDI, San Antonio, USA, 1985.

Comments