
March 2021, Vol. 248, No. 3
Features
Application of Distributed Fiber-optic Sensing for Pipeline Integrity and Security
By Dr. Alasdair Murray, Senior Analyst, Dominic Graham, Specialist Engineer, and Dr. Chris Minto, Engineering Director, OptaSense
Distributed fiber-optic sensing (DFOS) describes several technologies that can be utilized to convert a fiber-optic cable into an array of distributed sensors by connecting it to an optical interrogator unit (IU). Fundamentally, the technology relies on launching laser light along the fiber-optic cable and detecting light that is scattered back along the fiber.
As light propagates through the fiber, it interacts with microscopic inhomogeneities in the glass. These interactions result in a small fraction of the light being scattered — a smaller fraction of which is captured in the fiber-optic cable and propagates back toward the detection stage of the IU.
The scattering of light is a continuous phenomenon, and the optical fiber is stratified into channels that represent different locations along the fiber by using the time-off light between launch and detection. DFOS systems look to detect changes in the scattered light that result from the effect of physical events on the fiber. Vibrations, strain and thermal changes are the primary sources of signal variation, and by monitoring changes in the scattered light, DFOS can be used to interpret events occurring along the length of the fiber in real time.
Inhomogeneities in the fiber that lead to the scattering of light can be naturally occurring or artificially introduced. Naturally occurring mechanisms include Rayleigh, Brillouin and Raman scattering, while artificial mechanisms such as fiber Bragg gratings can also be used.
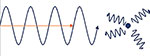
The OptaSense DFOS technology relies on Rayleigh scattering, which occurs from the interaction of light with sub-wavelength particles in the glass fiber. The oscillating electric field of the light interacts with the electric polarizability of the particles, which are induced to oscillate at the same frequency as the light and become radiating dipoles (Figure 1). A fraction of this scattered light is captured by the fiber-optic cable and propagates back toward the IU.
Rayleigh-based DFOS is typically considered to be a distributed acoustic sensor (DAS), which is sensitive to vibrations. However, technological developments are allowing Rayleigh-based sensors to be used as strain and temperature sensors as well, providing a full suite of detection from a single technology.
Brillouin-based technologies are generally used for distributed temperature or strain sensing (DTS/DSS), while Raman-based fiber-optic technologies are used solely for distributed temperature sensing (DTS).
Quantitative, Qualitative
Data produced by a Rayleigh DFOS system fall into two categories. Basic systems can produce qualitative- (or intensity-) based data; more advanced systems monitor phase changes and can output quantitative measurements of the relative change in optical path length between two points along the fiber. This is essentially a measure of the strain on the fiber though it isn’t strictly the same.
Qualitative-based systems are suitable for detecting that something is happening to the fiber. Quantitative systems may be necessary when knowledge is required about what is happening to the fiber.
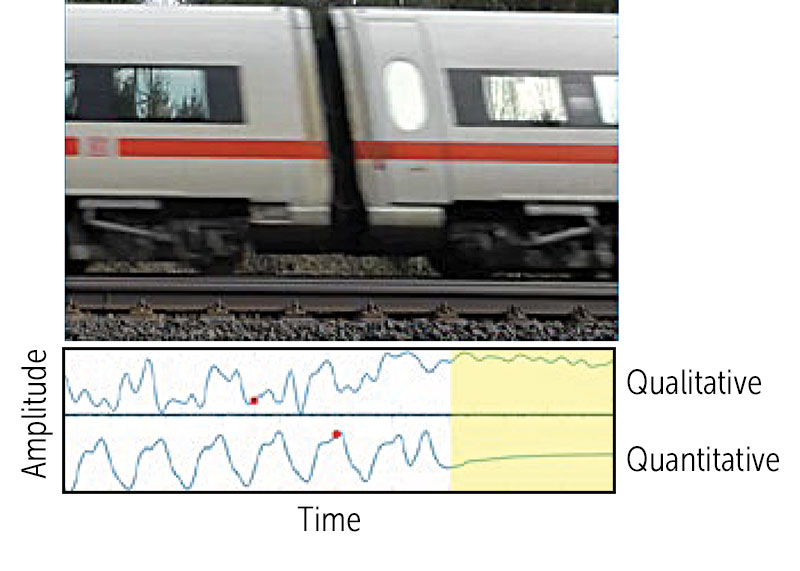
Figure 2 illustrates the difference between the two categories of the system in response to the passing of a train where the fiber is installed alongside the track. The shaded region to the right-hand side shows the behavior of each system prior to the arrival of the train, while the left-hand side shows the response as the train passes.
In the qualitative system, there is a clear disturbance to the fiber during the train pass; however, the quantitative system provides a much clearer and consistent response with the passing of each bogie.
A further difference between qualitative and quantitative systems is the interchannel response. In a qualitative system, the response of each channel is wholly independent of each other. In a quantitative system, the response of each channel will be coherent.
The coherent response of quantitative systems allows more advanced processing techniques, such as beamforming, to be performed and can enhance the signal-to-noise ratio.
For many applications, qualitative IUs are sufficient. These simpler systems benefit from their lower cost and wider range of operation and form the majority of global installations (though technological advancements may change that in the future). Impulses and vibrations are readily detectable and the combination of signal detection routines with logical processing creates heuristic algorithms that can classify a variety of events based on key characteristics.
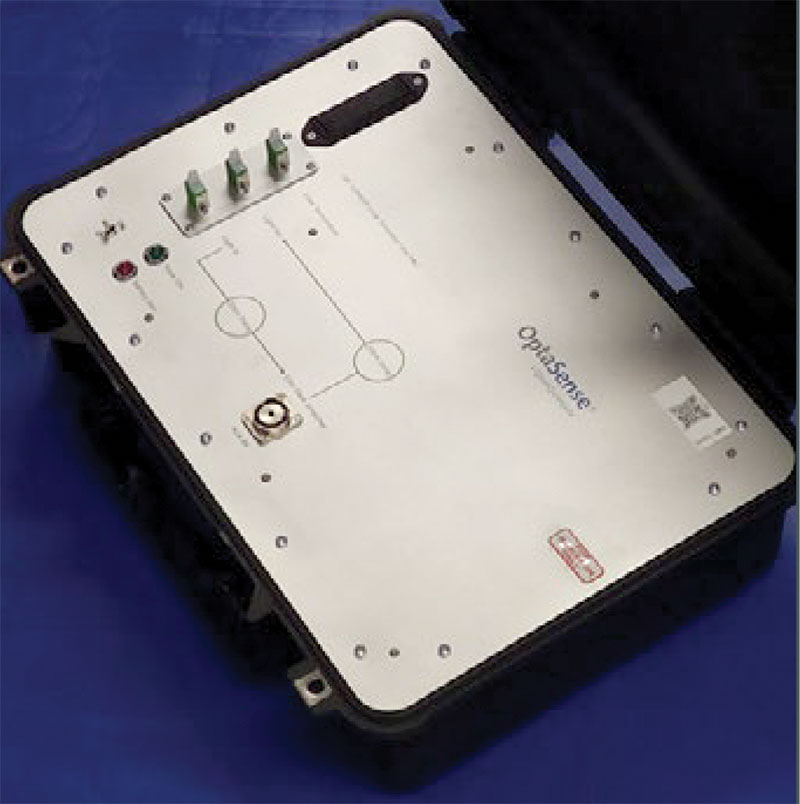
Hardware
OptaSense has a range of interrogator units that allow us to provide the most appropriate technology for installation requirements. The standard workhorse is the qualitative OLA2.1 unit, which provides 31 miles (50 km) of fiber-optic sensing and has been used all over the world for a wide range of applications. All other interrogator units in the range provide quantitative measurement capability.
The ODH4 is an advanced, short-range, quantitative interrogator. The ODH-F unit can operate as either a short-range quantitative system or as a longer-range qualitative system.
Finally, the QuantX and ODH5X IU’s are long-range quantitative solutions providing a similar measurement range to the OLA2.1. The ODH5X offers an optimized 6 miles (10 km) of sensing capability but supports a long lead in fiber for applications such as subsea monitoring.
Detection ranges are largely dependent on the amount of light being scattered back and are specified based on standard, single-mode fiber with a one-way optical loss not exceeding 0.25 dB/km. This range is typically specified as 6 miles for short-range solutions and 31 miles for long-range solutions, which OptaSense have defined based on where we consider the system performance to be acceptable.
Monitoring System
When it comes to pipeline monitoring, DFOS systems can provide three key areas of capability: leak detection, third-party intrusion and scraper tracking.
One of the core capabilities of a DAS pipeline monitoring system is the ability to detect leaks quickly and reliably. A leak can have a range of effects on the surrounding environment, and the OptaSense leak detection system continuously monitors for four different phenomena.
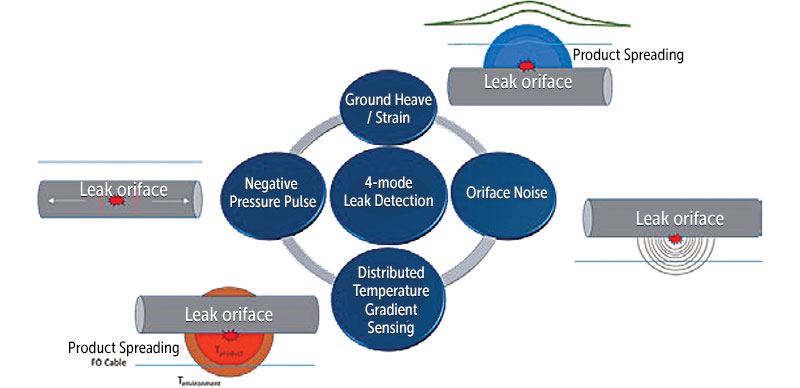
These are the negative pressure pulse (NPP), sometimes referred to as a negative pressure wave (npw), orifice noise (ofn), strain and temperature (DTGS). Illustrations of each of these effects (Figure 3).
Depending on the nature of the leak and the pipeline installation, some of these effects may not be observed. The four-mode leak detection system does not require all leak modes to be present for an alert to be raised.
At the instant a pipeline loses integrity, a pressure drop occurs. This drop in pressure generates an NPP that propagates inside the pipeline away from the leak location at the speed of sound in the fluid. As the signal propagates out in both directions along the pipe, it forms a characteristic V shape that points directly to the source (Figure 4).
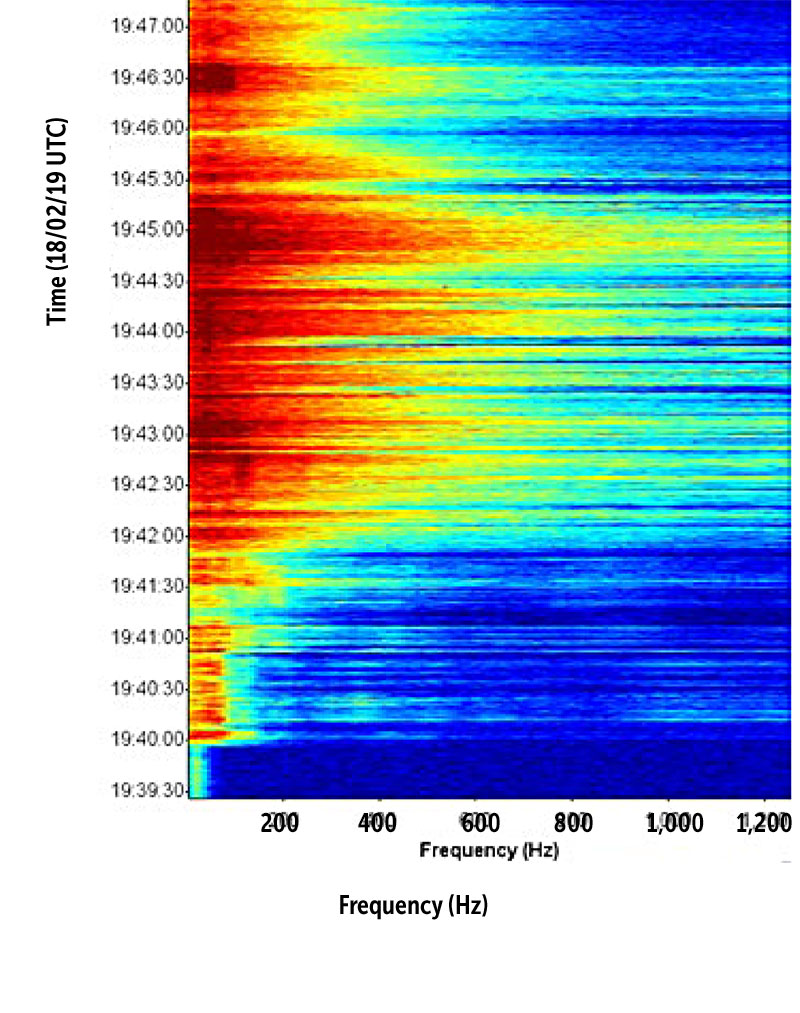
OFN orifice noise arises as fluid is ejected from the pipeline and causes vibrations in the pipeline and the surrounding environment. The effect of these vibrations appears as amplification of the spectral content in the vicinity of the leak.
The first 30 seconds of the data are prior to the leak event and the spectrum is typical of the background environment. When the leak begins, there is a significant amplification of the signal across the frequency range. The moment the leak valve is closed, the spectral content returns to that of the background environment.
Strain is the force of fluid being ejected from the pipeline and can cause the pipeline to flex and the surrounding ground to shift (for a buried pipeline). Ground movement is particularly noticeable in highly compressed gas pipelines where the fluid can undergo significant expansion into the surrounding area.
The effect of the fluid ejection imparts strain into the fiber-optic cable, which can be detected. The effect is visualized more clearly on a quantitative system, and Figure 6 illustrates the response of the system to a leak on two co-located optical channels.
After the start of the leak, an increase and relaxation in the measured phase is observed on both channels – the segment marked as “Strain.” A further increase in the measured phase is likely to also be the result of strain on the fiber resulting from further ground movement.
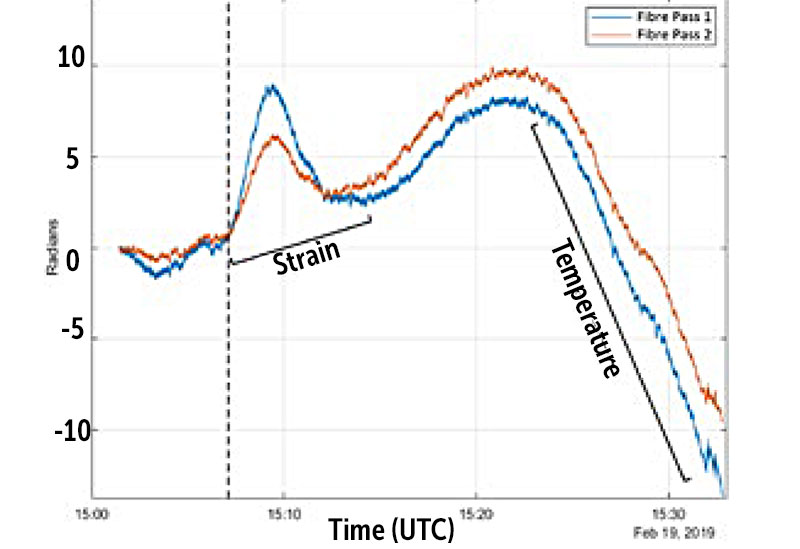
Temperature change occurs when a pipeline product is at a different temperature to the fiber (or undergoes Joule-Thomson cooling). Thermal changes will permeate toward the fiber during a leak event. While Rayleigh-DFOS systems do not directly measure the temperature of a system, they are sensitive to changes in the temperature.
As with the effects of strain on the fiber, it is easier to visualize the effects of temperature changes on a quantitative system. Referring again to Figure 5, the negative trend that is observed in the region marked “Temperature” corresponds with the effect observed as the fiber temperature changes.
This change occurs nearly 20 minutes after the start of the leak, owing to the time required for thermal effects to reach the fiber. Based on typical sensitivities, the change observed in the marked region corresponds to a temperature change of 20 mK, a change in temperature below the sensitivity of traditional DTS systems.
Quantitative Detection
Advances in quantitative systems have the potential to improve leak detection capability even further. With a strain- and temperature-capable IU, and the ability to separate the two from each other, Rayleigh-DFOS can be used to give absolute temperate and strain outputs by directly tracking each component’s movement from a calibrated baseline.
As well as opening a host of new applications, the potential benefits to leak detection performance are very exciting.
Over the last decade, leak trials have provided valuable data. Of note are the larger trials that we have undertaken at the full-scale flow-loop facilities of SINTEF in Norway and CTDUT (Pipeline Technology Center) in Brazil (Figure 6).
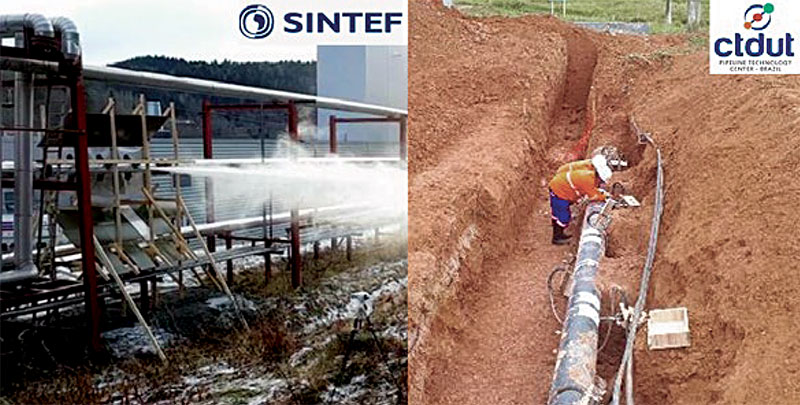
These are the most representative and realistic leak trials undertaken to date and have informed the performance bounds that are placed on the OptaSense leak detection system.
In 2017, OptaSense undertook a series of leak tests on a large, full-scale flow-loop run by SINTEF in Norway. The trial was conducted on an aboveground pipeline and tested 540 different conditions.
Liquid, gas and mixed-phase products were tested over a range of pipeline pressures and leak sizes. The trials at SINTEF were undertaken using a quantitative IU to provide the greatest possible understanding of the leak-induced behavior. Overall, this trial provided valuable data on the performance of the system; a more expansive white paper on the trial can be obtained by contacting OptaSense.
In 2019, to further validate the system and gain understanding of how small a leak can be detected, OptaSense undertook a further series of trials at CTDUT. This trial focused on a buried pipeline with the fiber installed 0.3 mile (0.5 m) away from the pipeline at the limits of the fiber installation specification.
Like at SINTEF, a bespoke test spool was installed on a 1.5-mile (2.5-km) flow loop that could host liquid, gas and mixed-phase testing. Leaks were initiated by rupture discs and automated valves to provide data on the effect of a sudden loss in pressure compared to a slower drop. The rate at which fluid leaked from the pipeline was controlled by varying the size of the leak orifice.
The use of burst discs allowed recreation of a sudden loss of pipeline integrity. As a result, the observed NPPs were significantly clearer compared to those obtained from the slower pressure drop arising with a fast-acting valve.
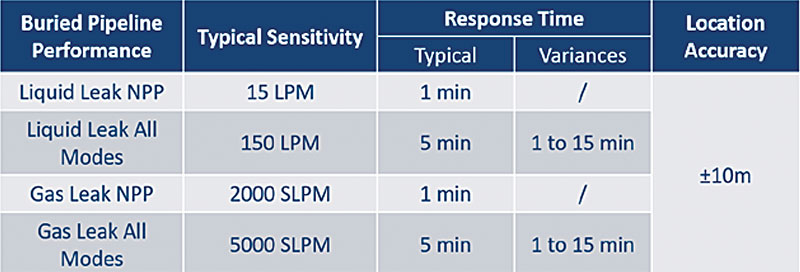
Extensive testing provides assurance that the system will detect leak events as intended. Using the data from all the trials, a specification was produced indicating the minimum detectable leak size and expected response times for the leak detection system (Table 1).
For the smallest leaks, the only indicator may be an NPP, at the instant pipeline integrity is lost. As such, this is the most valuable signal and can generate a leak NPP alert by itself.
While the detection is almost instantaneous, the stated 1-minute response time considers the amount of time required for a trained operator to acknowledge, investigate and confirm the alert.
The other three modes of leak detection are less sensitive, and for larger leaks the NPP detector is augmented with a fused leak approach. This builds confidence by combining detections from each of the leak modes. Recognizing that not all leaks are the same, it is not necessary for all leak modes to be present for the system to identify a leak.
While it is of course valuable to verify performance in controlled trials, it is recognized that clients often prefer reassurance from in-field validation on their own pipelines. To this end we have developed several methods for undertaking in-field validation while addressing the obvious issues that arise with starting an actual leak.
Methodologies
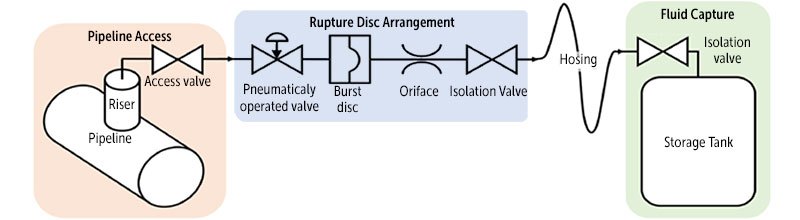
Burst disk testing at convenient access valves allows the generation of NPP signals within the pipeline (Figure 7). While this test does require confinement in the pipeline, the rapid reaction time of the test allows integrity to be restored swiftly and without significant loss of product.
Where environmental contamination is a concern, the product can be released into a suitable container for capture. Alternately, it may be a viable option to replace the product in the pipeline for the purposes of testing.
Early in 2019, a client undertook burst disk testing of their own to demonstrate the operation of the system while engineers were available to provide remote support and guidance. After identifying and resolving an issue arising from a trapped pocket of air in the pipeline, the testing was completing successfully.
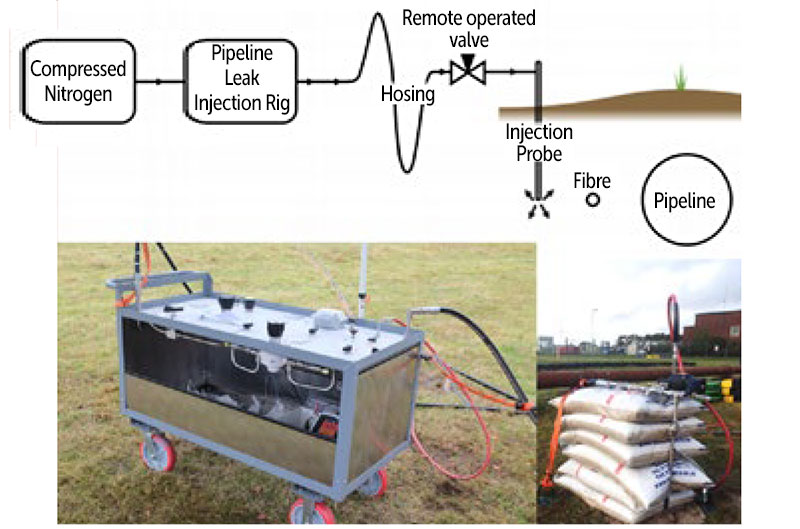
Ground fluid injection at high velocity allows replication of the signal’s associated orifice noise, strain and temperature effects on the fiber (Figure 8). These leak signals require extended durations to validate performance, which can only be undertaken with environmentally safe materials.
An injection probe is inserted into the ground on the opposite side of the fiber to the pipeline at an equivalent offset. This reduces the likelihood of pipeline damage from probe installation and during the test itself.
The response of the leak detection system is the result of physical changes to the monitored optical fiber. Recognizing that it is difficult and undesirable to replicate a physical leak, the leak simulation unit (Figure 9) allows stimulation of a test fiber with representative signals that have been obtained from other leak tests.
In a similar way to how a loudspeaker replicates electronic signals to a form we can hear, the effects of a leak on a fiber are recorded using a quantitative DAS system, which can then be replicated via a fiber stretcher. This portable system can be connected into a system at suitable access points. The system is a point stimulator and, as such, the NPP signal cannot be replicated by this method.
In the future there is a desire to offer leak validation through the injection of synthetic data.
In support of this goal, OptaSense have used quantitative systems wherever possible during leak testing to provide the basis for understanding and developing the representative models necessary for synthesizing leak data.
Pipeline leaks may occur naturally while others may be the result of intentional sabotage. The second of the three core capabilities in a DFOS PIMS system is for the monitoring of TPI.
A prelude to intentional sabotage will be likely to include a range of activities in the vicinity of a pipeline. Such activities involve personnel and manual or mechanical tools, which can be detected and categorized by the DFOS PIMS system. Of course, there can be other reasons to monitor for TPI beyond the prevention of pipeline leaks.
Mechanical digging can be separated from manual digging by virtue of larger amplitude signals and the presence of tones arising from the engine. An issue of great concern to some clients is that of illegal hot tapping.
In the buildup to a hot tap event, there will be detectable activities observed in the vicinity of a pipeline prior to the event itself. Personnel and vehicle movements, digging and drilling are all likely to occur in a localized area and be detected by the DAS system.
As alerts are raised on these events, an operator can raise a suitable response prior to the pipeline integrity being compromised. Not long ago, a client observed unusual activity on their system – several vehicle alerts along with personnel and digging alerts occurred over several minutes at a single location. In response to these alerts, the operator informed the local security who were dispatched to the identified location.
A search of the area revealed fresh ground disturbance, and a cache of tools was discovered under nearby bushes. Thankfully, on this occasion, the pipeline was not compromised.
The third area where DAS can be used is in the tracking of scrapers through a pipeline. As the scraper interacts with the walls and features of the pipeline, it generates considerable signal.
The ability to identify and track the scraper is a valuable capability for several reasons.
Foremost, the signal generated by the scraper has the potential to be a source of nuisance alarms. Key to suppressing such alarms is knowledge of the location of the scraper. Further benefits arise from knowledge of how the scraper is moving through the pipeline.
The speed at which the scraper is moving can allow estimation of the arrival time at the destination, while variations in the speed can indicate restrictions on flow such as the buildup of material within the pipeline or even pipeline damage.
It is possible that a scraper could become completely stuck, and knowledge of the accurate location of the scraper will minimize the cost and time of recovery.
Typical system architecture enclosures, along the length of the asset house two optical interrogation units to provide up to 62 miles (100 km) of fiber-optic coverage from each site.
Each enclosure is networked together (via another optical cable) to provide “anywhere” access. The networking of all the systems supports the database redundancy of the system that allows nodes to be lost/replaced without having to reconfigure the entire system.
At any location along the asset where network access exists, control units have access to all interrogation systems that are installed to allow remote monitoring, tuning and configuration.
In principle, systems can be implemented within existing telecommunication infrastructure on any spare, single-mode fiber-optic cables.
Authors: Dr. Alasdair Murray OptaSense Senior Analyst; Dominic Graham OptaSense Specialist Engineer; and Dr. Chris Minto OptaSense Engineering Director
Editor’s note: This paper first appeared in Pipeline Technology Journal. June 2020.

Comments