
September 2020, Vol. 247, No. 9
Features
A Clearer Picture: How Phased Array UT Delivers 3-D Results
Today’s advanced phased array UT instruments and software give technicians the computing power to transform traditional 2-D inspection data into full-color 3-D visualizations.
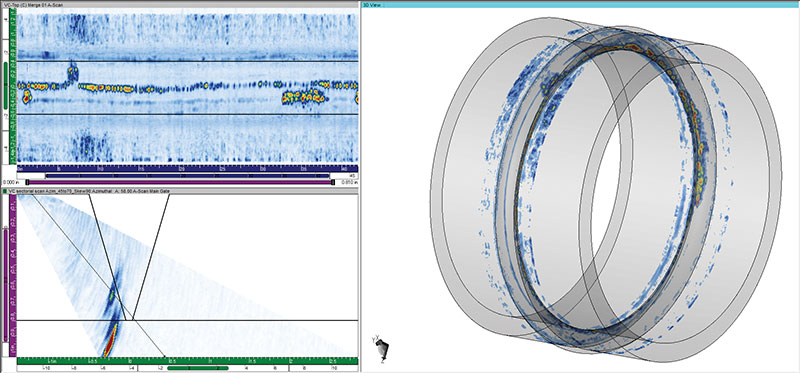
Essentially, the process involves merging data from 2-D scans taken from different positions and angles and overlaying it onto a CAD file or 3-D rendering of the pipe, joint, weld or other type of specimen that’s under test.
Software packages like Zetec’s UltraVision can also simulate acoustic beams and characterize the energy distribution from any given probe, including single-element (conventional UT), 1-D-linear arrays and 2-D-matrix arrays.
These renderings are so clear and detailed that you don’t need a deep understanding of UT scans to easily recognize corrosion, weld defects and other indications on the screen.
Having a clean, easy-to-interpret picture on the screen, in a moment, lets inspectors and clients alike clearly see the condition of their assets to help inform their decisions about safety, uptime and code compliance.
Author: Guy Maes is sales engineer director for UT solutions at Zetec, a nondestructive technology testing solutions company. He has more than 30 years of experience in advanced UT method development and implementation.

Comments