July 2020, Vol. 247, No. 7
Metering and Measurement
Lost and Unaccounted For: Measurement Operations Adapting to Technology
By Ed Hanks, Vice President, C-SMART Analytics Technology
Our world has changed. We face work restrictions that have shut down our offices, restricted our travel and hampered daily operations. We have had to accelerate the use of technology while learning to adapt to the new “normal.”
The oil and gas industry is risk-adverse and values proven technology with measurable key performance indicators (KPIs). Natural gas flow measurement is not an exception.
This article studies how the internet of things (IoT) coupled with augmented or smart analytics technology can improve measurement performance, simultaneously saving cost and reducing risk by changing from the paradigm of scheduled calibration and maintenance of metering stations to calibration and maintenance by exception.
Case Study
With the advent of smart, electronic metering technology, such as ultrasonic meters and online gas chromatographs, the diagnostics information available at metering facilities has increased exponentially. Likewise, advancements in networking has made collecting the diagnostics data possible.
C-SMART Analytics has been working with major pipeline companies since 2013 to develop and implement a solution to leverage the technologies. This article studies the implementations.

The KPIs Test
An important KPI for pipeline measurement teams is lost and unaccounted for (LAUF). The following graph illustrates the LAUF trend for the industry. The graph was developed from analysis of data provided by pipeline operators to the Energy Information Agency (EIA) through 2018.
Graph 1 shows that between 2012 and 2018 the industry’s LAUF has trended flat, averaging 0.35% (maroon series). The blue series illustrates EIA data for the case study pipelines. The LAUF trended down from 0.20% to less than 0.05% over the period.
Along with the LAUF KPI, the case study also included analysis of detailed data for the period of 2015 to 2018, providing further insight into the LAUF improvement. Three additional KPIs were analyzed: 1) the frequency of measurement error detections, 2) the response time to resolve detected issues and 3) the magnitude of the error. The data were normalized to express the results per 328-foot (100-meter) stations.
Graph 2 shows the number of days it took to correct an issue, the response time, decreased by 34%.
The response time includes several factors: 1) prioritizing the event, 2) ordering parts as needed, 3) scheduling the equipment and resources needed to perform the work and 4) making operational arrangements to perform the work, for example, scheduling a shutdown for maintenance.
The downward trend suggests continual improvement as operators learn to trust and use smart analytics. This downward trend makes sense in light of the LAUF trend.
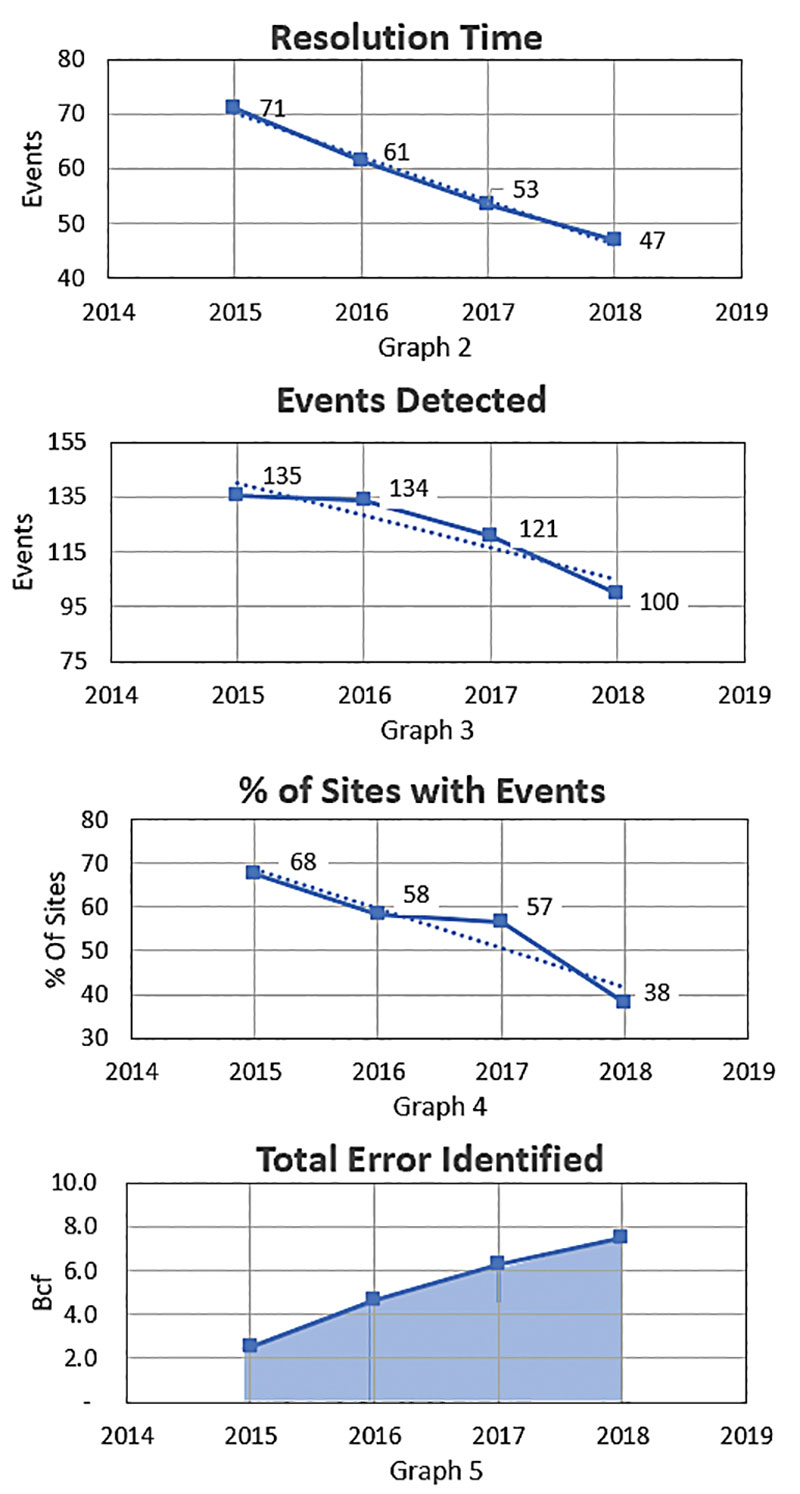
Graph 3 shows that the number of detected measurement error events decreased by 26%, again suggesting that continued use and familiarity with the smart analytics had a positive impact on measurement operations.
The analysis also showed that the percentage of sites where smart analytics detected issues decreased by 44% (Graph 4). Combining the previous two findings shows that, over time, the measurement error events are concentrated at particular sites, allowing operation teams to focus their resources on problematic sites.
The analysis showed that as smart analytics are trusted and integrated into operations, the results are 1) decreased measurement error event resolution times, 2) decreased number of measurement error events and 3) greater focus on problematic meter stations. Over the 4-year period, the technology helped the operators to identify and correct more than 7.5 Bcf of measurement errors per 100-meter stations (Graph 5).
Detailed Look
The analysis identified events such as ultrasonic flow meter (UFM) transducer and electronics issues, flow computer issues, contamination or debris in meter tubes, pressure and temperature measurement issues, and chromatograph issues.
Of the total events, 46% included sufficient diagnostics information to estimate an error and provide maintenance recommendations, such as replacement of ultrasonic meter transducers, meter cleaning and removing debris from in front of the flow conditioners (uncertainty estimates were developed from data sets collected at the CEESI calibration facility, an ISO 17025 laboratory), or various flow computer, chromatograph, and pressure and temperature transmitter failures.
Of the events detected, 52% contained sufficient information to identify preventative maintenance or noncritical equipment failures that did not cause an appreciable increase in uncertainty such as degradation in a ultrasonic meter transducer performance, ultrasonic noise affecting the meter, chromatographs in hold mode or not auto-calibrating, and pressure or transducer drift.
Only 2% of the events detected identified an error, but the failure was such that there was not sufficient diagnostic information to reasonably estimate the impact, such as total equipment failures where there were not data available to develop estimates.
Guaranteed Value?
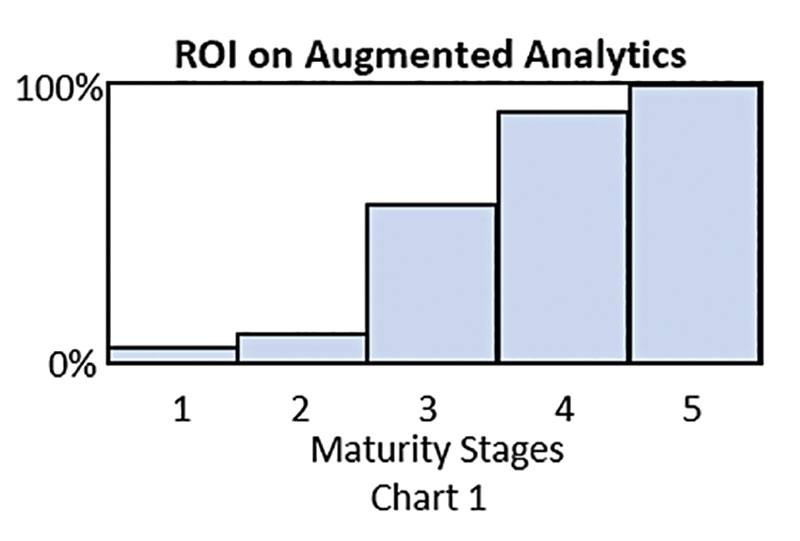
IoT experts speak of the IoT maturity index. Solutions that provide built-in analytics and business logic that automatically alert operators of issues provide significant ROI to companies. Chart 1 illustrates the IoT maturity stages. The first stage is device connectivity, the second stage is dashboards.
The third stage is developing analytical techniques for identifying issues from the data. The fourth stage is developing and automating business logic based on the analytical techniques from Stage 3.
The final stage is continued improvement of the analytics and business logic. Chart 1 shows that for augmented analytics investments to provide significant return, the implementation of the technology solution must be at Stage 4.
Furthermore, with the rapid evolution of technology, maintaining a Stage 4 solution requires continued adaptation and development.
Conclusion
Augmented analytics and IoT can provide the operational information to move operators from the paradigm of scheduled calibration and maintenance of metering stations to calibration and maintenance by exception, eliminating the need to regularly send personnel to the metering facility.
Furthermore, metering stations now produce enough diagnostics data to remotely, and in real time, identify and estimate measurement errors. This technology allows operators to optimize measurement resources while managing measurement risk. Implementation of technology improved LAUF and decreased the number of measurement errors and the time to resolve them.
Author: Ed Hanks is vice president of C-SMART Analytics, having joined West Energy in 2011. Previously, he worked at Boardwalk Pipelines in the measurement technical support and design team. Hanks holds bachelor degrees in electrical engineering and physics.


Comments