January 2019, Vol. 246, No. 1
Features
Pipeline Software Keeps Alberta Project Efficient Despite Mud, Cold
By Jason Rossback, Trimble, Inc., Sunnyvale, Calif.
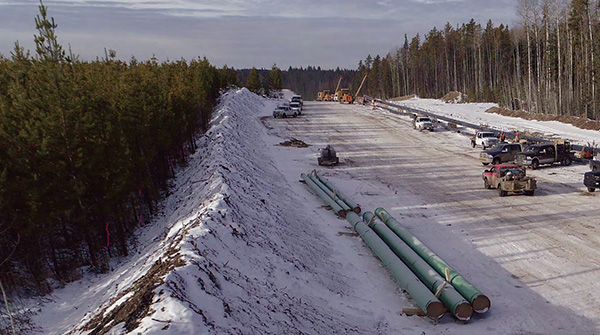
The landscape alone can challenge any pipeline project, but conditions reach extreme levels quickly when natural elements, such as thigh-deep mud and 40-below temps, intersect with the man-made constraints of a large-scale project encompassing thousands of joints, a fast timeline, multiple sections simultaneously under construction and no room for error.
McElhanney Geomatics Engineering, a provider of surveying, mapping and geomatics solutions in the oil and gas sector, faced all of these conditions and more when it started a 174-mile (280-km) pipeline project in northwest Alberta, Canada.
The project included laying a 24-inch pipe and a 16-inch pipe, both licensed for HVP liquids (ethane, propane and butane), for the pipeline operator. McElhanney’s work on the project lasted 11 months and spanned public and private lands, foothills, rivers, streams and dense forests. The work included clearing limits, pipe inventory and field data collection.
“It doesn’t matter if it’s warm or cold,” said Geoff Louks, a manager for major projects for McElhanney. “When you’re doing a pipeline, you get one shot at it.”
A software solution from Trimble specialized for pipeline surveying played a critical role in ensuring correct documentation for the entirety of the project, especially as crews addressed extreme elements combined with challenging project tasks and timelines.
“We did some other smaller jobs with it,” Louks said, “but this was the big test.”
Temperature Swings
Geologically, northwest Alberta is a region known as the Boreal Forest, an ecozone that is heavily forested and covered with muskeg – a North American bog consisting of water, partly dead vegetation and layers of sphagnum or other mosses. The region also includes farmland, high and low foothills, and creeks and rivers draining north and east from the Rocky Mountains.
“In the fall, a big rain came through, and with the melting snow on clay, you get quite a significant layer of mud,” said Gerald Andreiuk, a survey engineer who led quality assurance/quality control efforts for the project. “It sticks to your boots. You can easily take a step and you are sliding, so you can’t get close to the trench, for obvious safety concerns.”
The mud also got deep. “We have a picture of a guy with an Argo, a tracked vehicle,” Louks said. “He hopped off the Argo, and he was up to his waist in mud. That was in May.”
The climate pushed the extremes as well. Characterized by strong seasonal variation, the region has short, moderately warm and moist summers and long, cold and dry winters. Seasonal temperatures can fluctuate from summer highs of 86 degrees F (30 degrees C) to the -40s C/F in winter, with January being the coldest month.
“There were times when it was the better part of minus-40,” Louks said. “Once it gets to that extreme, everything just shuts down.”
Data Deluge
For McElhanney, based in Edmonton, Alberta, the northwest Alberta pipeline project also pushed the boundaries of data management and analysis.
Because of its large size, the project was divided into four different spreads – or manageable lengths – between two contractors, with McElhanney’s team splitting to serve both. To staff the project, McElhanney used 25 two-man survey crews, three field supervisors, three quality assurance/quality control people in the field, along with two project managers in the office.
On a small job, the surveying process is simple because construction flows from start to finish, Andreiuk said, but on the northwest Alberta project, work happened simultaneously along different sections of the line, making data management a challenge.
“We had a master list provided from the client of the approved pipe and heat numbers that were involved in the line, so basically, we are checking and confirming the order of every individual joint put into the ground,” Andreiuk said. “The biggest challenge was the volume of data and the speed with which the contractor was constructing the pipeline.”
Even in the worst of conditions, pipeline data still has to be collected. Increasing regulations mandate data on where a pipe was made, who manufactured it, precisely where it is located in the ground and where welds are located spatially. This kind of data not only makes installation safer and more efficient, it also helps with monitoring of the pipeline as it ages.
For the northwest Alberta pipeline project, McElhanney relied on Trimble Access Pipelines to keep track of 20,000 pieces of pipe in the project inventory, as well as strung pipe, welded pipe, pipe as-built measurements and reporting.
Trimble’s software for pipelines includes powerful tools to collect pipe attribute data, record the relationship between welds and pipes (joints), and then, when the pipeline is surveyed, link the joint attributes to the measured welds
“Trimble Access Pipelines basically gave us all of the information, linked at the end of the day, so we didn’t have pieces of information everywhere,” Andreiuk said. “Each individual piece of information is linked to another. By having that organization, you can start mass producing it in spreadsheets and can manipulate the data in whatever fashion you want.”
Unique Challenges
In the field, McElhanney’s crews used eight Trimble Tablets and 23 TSC3 controllers with Trimble Access Pipelines installed on each. For the pipe as-built measurement, the team used Trimble R10 receivers.
Project activities included:
As-strung pipe tally: Due to the large (over 20,000 pieces of pipe) size of the tally file McElhanney used the Trimble Tablets for this work. With the tally file uploaded to the tablet, the crew only needed to type in the pipe number and the module populated the rest of the fields, which made the task go much faster. Any errors in pipe information could be easily reconciled. A crew would tally about 100 pipes per day on average. “With the pipe tally, we would be documenting each individual segment of pipe,” Andreiuk said. “Without that, our whole system falls apart. If we don’t collect that piece of pipe and we try and weld it to another piece of pipe, that weld is not holding the full amount of information it should.”
As-welded pipe tally: Once the pipe was welded, the crew used the as-strung file and added the X-ray numbers for each weld and confirmed the upstream and downstream pipes between the welds. If any of the as-strung pipes had been moved from the original order, the module would let the crew know.
Pipe lower-in: Once the pipe was welded it was lowered into the ditch. McElhanney would do an as-built of all linear features on the pipe at this time. Comparing the as-strung/as-welded files, the module could tell the crew immediately if the pipe order, x-ray numbers or pipe lengths differed, and the issue could be resolved at that time.
Reporting: With the as-built file, McElhanney was able to build with the module, which made creating various pipe reports much easier and faster.
Typically, a pipeline starts with an inventory of what has been deployed to the jobsite and a tally that involves physically inspecting the inventory to make sure it matches what is on the manifest, Louks said. When a pipe is welded before it is put into the ditch, those welds go into a weld map, which links all of the welds to the attributes to the individual pipe.
“One of the things I really like is, if something is odd, it lets you know right now,” Louks said. “You are aware of it, and you can try to figure it out and fix it, as opposed to two weeks down the road when the guy is looking at the data and said, ‘where did that five meters of pipe go?’”
The pipeline module also helped McElhanney’s team spend less time outside – a big advantage when the weather is sub-freezing and the landscape is treacherous.
“At the end of the day, once we’ve done our tally and weld mapping, we take that big file and dump it into Trimble Business Center, and there it is,” Louks said.
The software also helped project managers merge data from different crews at the end of each day, so they could get started the next day with a full data set.
In addition, because every feature in the as-built database needs an offset to the right-of-way boundary, someone must sit down and physically figure that out, Louks said. If the surveyor sets this up in their controller using Trimble Access Pipelines, however, it will do the work for them.
“We learned that three-fourths of the way through,” Louks said, adding that a “lessons learned” meeting is planned so the McElhanney crews can maximize the capabilities of the pipeline module for the next project, whether straightforward or pushing the extremes.
“With the very large amount of data involved,” Louks said, “I don’t think we could have done this project without Trimble’s pipeline application. I also believe that we have only scratched the surface of what the module can do.” P&GJ
Author: Jason Rossback is a product marketing director for Field Solutions at Trimble, Inc. He has been with Trimble for 10 years focusing on surveying and mapping in many different markets. He and his team spent over a year working with customers in the field to design and develop Trimble Access Pipelines.

Comments