
August 2019, Vol. 246, No. 8
Features
Analyzing Pipeline Records Discrepancies Efficiently
By Sam Acheson, Ollie Burkinshaw and Simon Slater, ROSEN
The pipeline industry is working with an aging infrastructure, with about two-thirds of existing U.S. pipelines constructed before the 1980s.1 This creates unique challenges for analysis and decision making with the pipeline asset data.
For pipelines constructed today, technology provides mechanisms for effective and efficient routing and design, survey grade data collection technologies allow for capturing accurate location and properties at each weld, and standards-based data formats for storing this data have all contributed to our ability to establish a robust and accurate representation of the pipelines in database system.
We additionally have powerful tools that enable efficient management of the volumes of data necessary to retain an accurate digital twin of the pipeline system. Complete, accurate, and traceable data collected through these methods provides confidence through analysis and decision making.
However, most of the pipeline data we rely on today was not acquired at these standards. The data we use to manage over two thirds of the pipelines in operation were digitized from alignment sheets and compiled from historical records and personal knowledge of these systems.
Also, the majority of data was not collected in a fashion meeting the rigor of current standards. This has created a reluctant acceptance of inadequate, inaccurate, and incomplete data. These “unknowns” lower confidence in decisions made from our pipeline data systems and have resulted in organizations foregoing the use of this data for integrity management practices.
This creates a unique challenge for our industry – a lack in confidence in critical asset data. It is imperative we are confident in our pipeline data, and we must work to make this data more complete, robust and accurate.
Current State
In the last two decades, the pipeline transmission industry has been digitizing paper records within geographic information systems (GIS), and creating a pipeline systems of record. This effort, while being effective in creating a GIS representation of the assets, has resulted in data that does not meet the accuracy demands of the increasingly complex and stringent regulatory environment.
Through proposed rulemaking, (NPRM) 49 CFR 192, PHMSA is enforcing that data have positional accuracy ±5 feet of its geographic location in a high consequence area and ±50 feet for other natural gas and hazardous liquid lines. Proposed rulemaking has also added more attributes/physical characteristics as required for submission.
As a result, many operators are beginning the arduous process of correcting the spatial accuracy of pipe center lines, reviewing the location of features on the line, and validating of the properties describing the pipe and related features. (Figure 1)
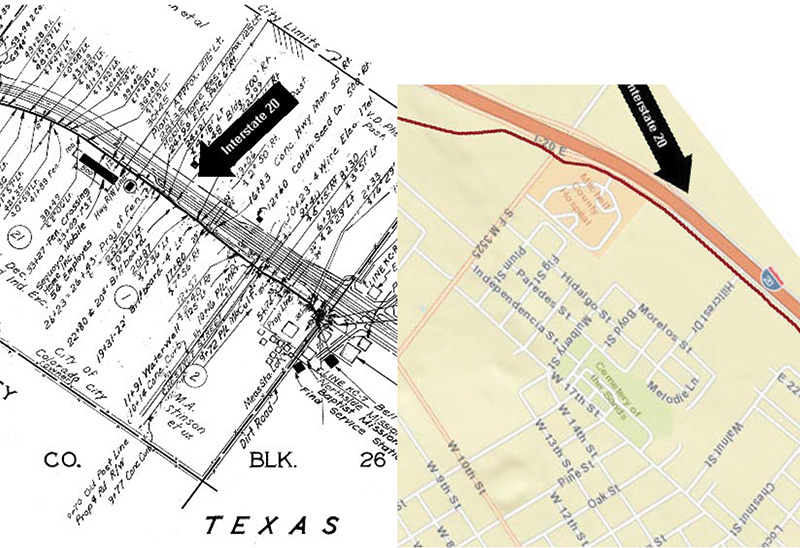
Fortunately, a method exists that generates accurate pipeline locations, yields the physical characteristics of the pipe, and captures the location of features on the line through modern in-line inspection processes. Once this data has been captured and processed, it is then possible to compare it with the existing pipeline database and provide analysis to show differences between the operator’s pipeline record and the inline inspection results.
This process is called “discrepancy analysis.” The aim is to increase the confidence in data representing complex pipeline networks, based on the location of the pipe center line and features on the pipe to the characteristics of the pipe and its features. Discrepancy analysis is achieved through a combination of inline inspection technology, software analysis, and subject matter expertise.
Discrepancy Analysis Explained
At its simplest, discrepancy analysis is the process of comparing two data sets, which ostensibly apply to the same segment, to identify likenesses and disparities, prioritize discrepant areas, and investigate incongruities.
While the intended result is to supplement or modify the system of record with more accurate data, it is critical to note it is not suggested that the data collected during inline inspection be introduced to the system of record until a thorough investigation is complete.
All data must be aligned as well as spatially and linearly analyzed. Discrepancies must be thoroughly investigated to conclude which findings offer the highest degree of confidence to supplement or override existing pipeline data. Discrepancies are then relayed to the operator, where we work to investigate, confirm, and commit the changes back to the system of record.
The method to properly execute a thorough analysis can be summarized by the following phases:
- data acquisition
- data preparation
- analysis and reporting
- employing the results
Data Acquisition
Discrepancy Analysis begins by conducting an inline inspection of a pipeline to acquire a wide range of data on the location of the pipe, the defining attributes of the pipe, and a wide range of features on the pipe providing a complete representation of the pipeline and features on the line.
An accurate pipe center line is generated using complimentary technologies, an internal mapping unit (IMU), the placement of above-ground markers (AGMs), and post-processing of the data. The IMU technology is built into the inline inspection tool and detects inflections of the inline inspection tool as it navigates through the pipeline.
This process yields a linearly accurate center line that may not be a spatially accurate representation of the pipe on the ground. When this data is corrected against survey-grade AGM placement, the inline inspection center line can be corrected to the known points, and an accurate representation of the pipe location is generated.
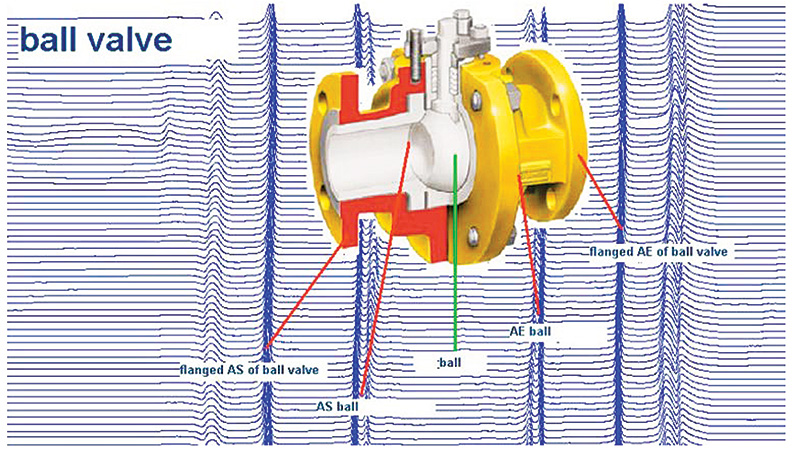
The sensors deployed on in-line inspection tools are designed to detect flaws such as corrosion, dents and cracks. These sensors will of course pick up signals when the pipe wall thickness gets thicker (for example at a forged bend), if there is an offtake (locally no pipe wall), if there is a sudden dramatic increase in thickness (a flange).
Years of experience and testing has taught data evaluators how to recognise these common features in the data. An example of a ball valve is shown in Figure 2. It is possible to identify multiple feature types from the signal strengths and patterns. This includes different component types (valves, tees, taps, flanges) as well as other elements (taps, casings, sleeves, supports).
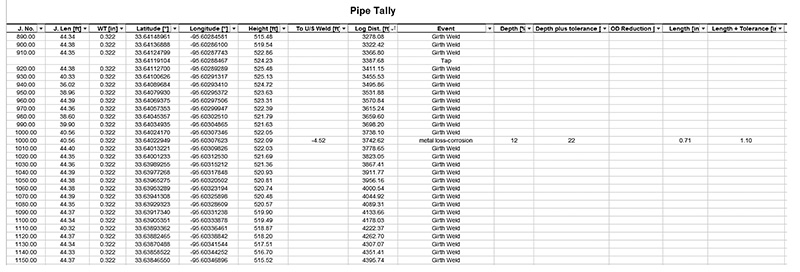
After the inline inspection run, data is processed, and a pipe tally listing is generated to provide a report of all recorded features along the pipeline. These features are classified into their appropriate feature types (valves, tees, etc.) and identified at specific points along the line (Figure 3).
The inspection will also identify and assign other characteristics to certain components. For example, pipes and bends will be assigned wall thickness values when using MFL- or UT-based inspections, with the addition of material strength and pipe grade when using more advanced inspection technologies.
Data Preparation
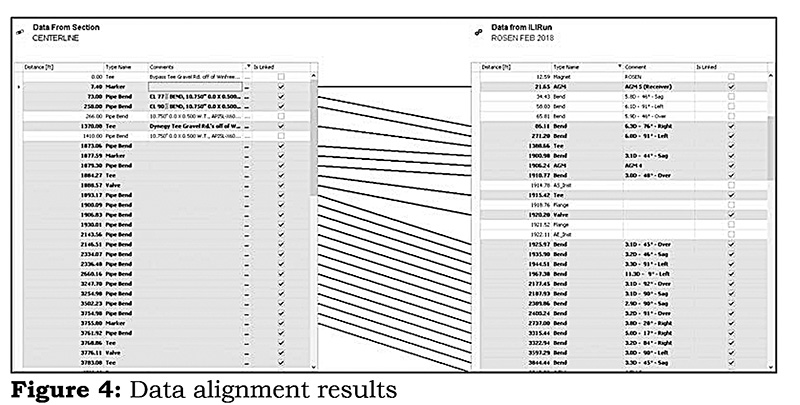
Once the datasets have been gathered and formatted into complimentary structures, typically in a GIS measured center line and a pipe tally report, an alignment is performed between the inline inspection data and the source dataset from the operator.
The alignment focuses on the linear representation of the pipeline and features on the pipe. This process involves establishing controls to identify and link similar features between the two datasets, and is concentrated on known data points, valve-to-valve matching, for example (Figure 4). Tolerances are set to allow for reasonable variability between the ILI center line and the center line provide by the operator.
Spatially enabled database alignment is recommended as a first step in creating improvements in the data as it allows for a visual “true up” for any inconsistencies between the datasets. It also provides a verification of pipe classification which will later provide weight in prioritizing discrepant areas
Once the alignment has been executed and verified, there is a reasonable assurance the stationing on the pipeline is complementary to the system of record and the analysis can begin.
Analysis, Reporting
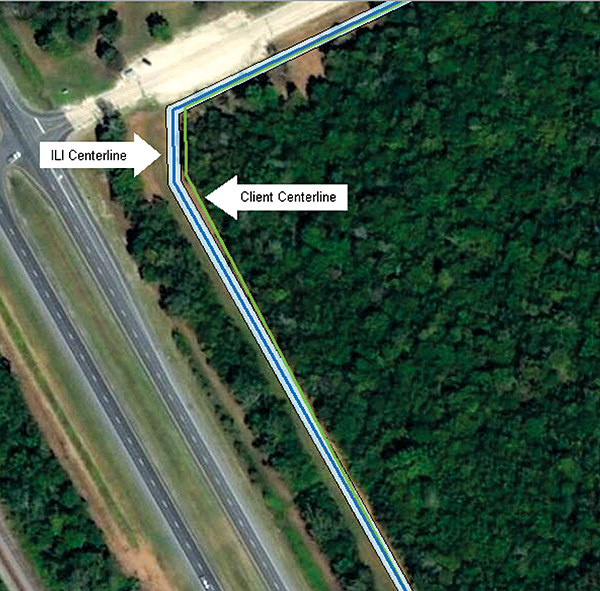
In cases where inline inspection has been run with an accurate survey and AGMs have been placed, the IMU provides a 3-D pipe center line representation. This pipe center line representation is converted to a GIS feature, allowing for further analysis against the source feature from the operator.
The IMU generated pipe center line is compared against the source center line (current pipeline representation) and evaluated for the following:
- Spatially coincident: Areas where the IMU-generated center line and the source data are within the established tolerance.
- Spatial discrepancy: Areas where the IMU generated center line and the source data are greater than the established tolerance.
Each area in which the values diverge is logged as an area of spatial discrepancy.
Figure 5 illustrates spatially discrepant areas.
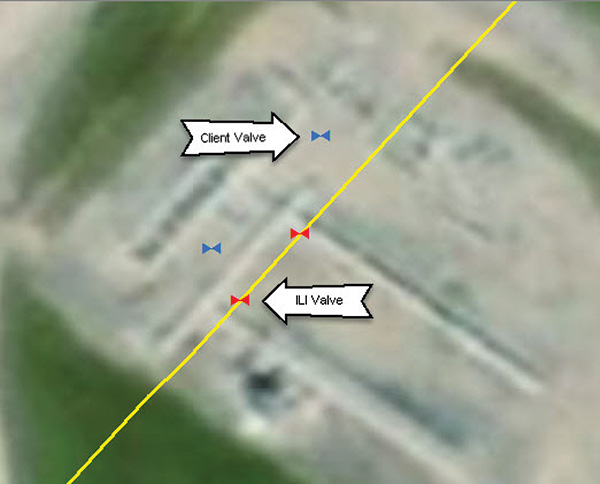
For each of the features along the pipeline that the inline inspection tool can identify (valves, casings, etc.), the linear location of these features are noted in the pipe tally report. These values are compared against the source dataset for both the beginning and ending location of the feature, and certain attributes of some features (tap diameter, for example).
The analysis looks for data that exists in either the source or comparison dataset then identifies the beginning and ending measure of each feature. When the same feature is identified in both datasets, the beginning and ending measures are also compared. This allows the evaluation of both the existence of features, and accuracy of the feature location on the line. Figure 6 shows a feature comparison.
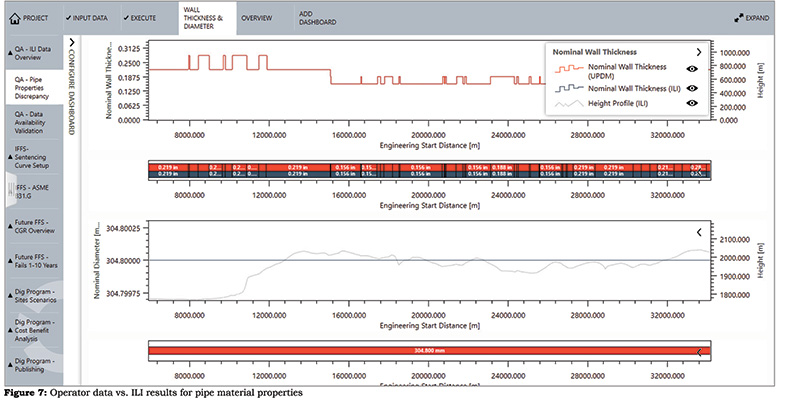
Attributes analysis includes a study of the defining characteristics of the pipe including pipe diameter, wall thickness, pipe type (welded or seamless), joint length, yield strength and tensile strength, and the identification of off-takes, valve type, diameter, etc.
The tally of expected characteristics provided by the operator is compared against the data captured by the ILI run and evaluated for discrepant material details. The operator is provided with novel discrepancy types, which can be reported on a pipe-by-pipe basis. The attribute analysis provides an evaluation of materials to complement the spatial and linear location comparison.
Figure 7 illustrates a linear analysis of pipeline materials between operator data and ILI results.
Employing the Results
The discrepancy analysis provides valuable insight to the quality of the data stored in the pipeline database. The results provided through the analysis allow the operator to engage in a systematic data quality improvement plan, by identifying areas of the most concern, providing a baseline for further analysis, and by measuring progress against well-known data points.
To assess the magnitude of the discrepancy, inconsistencies are prioritized and ranked by verifying the results through as-built diagrams, paper records, subject matter expertise, and additional surveys.
Ultimately, looking to update the pipeline database with a more accurate, more compete and verified representation of the pipeline assets, the operator can continue to evaluate discrepant areas with thorough analysis to validate findings. Pipeline operators have used the analysis results to gain insight to the integrity of their pipeline data and to begin to improve data quality, accuracy and confidence.
A large natural gas transmission operator is currently using the analysis for center line verification to address known spatial inaccuracies in their pipeline GIS. Using a combination of the cumulative miles of pipelines they manage as well as the knowledge of where to focus efforts, they can break down and manage the seemingly insurmountable task of increasing the spatial accuracy of the pipeline records.
A spatial discrepancy report:
- A finite list of areas of concern, which saves significant time by prioritizing areas for research and validation while adhering to internal data correction processes
- Visual confirmation of known areas of spatial deviation
- A recent, inline inspection generated center line that acts as a visual confirmation throughout the center line correction process
Another benefit identified by the client is the increased level of confidence the team has in making the corrections to the data. With the accurate center line provided from the inline inspection, coupled with the validation process identified internally, the data management team is more assured the changes that are being made to the data are accurate.
Material Properties
Another example of a discrepancy analysis is the use of ILI for material property verification in line with proposed changes to regulations concerning material properties. ROSEN has developed the RoMat PGS service to support operators in establishing traceable, verifiable and complete material property records.
Using RoMat PGS, strength values can be defined for each pipe and bend along an inspected section, as well as other defining characteristics including pipe diameter, wall thickness, pipe type (welded or seamless) and joint length.
The combination and analysis of these datasets using ROSEN’s Pipeline DNA approach allows all pipes and bends to be grouped into “populations” with shared properties and characteristics. Consideration of the strength distribution of pipes within a population allows a single-strength grade to be assigned to each population, replicating the information that would be available from manufacturing records.
The service is delivered via proprietary sensors added to a standard magnetic flux leakage inline inspection tool. The alignment enables the operator to compare the material records for each segment of the pipeline against the findings from in-line inspection.
Prior to inspection, the operator will provide a tally detailing the expected pipe characteristics, including pipe grade. By comparison with this listing and the operator’s data source, as a discrepancy analysis, the RoMat PGS service provides the operator with a number of novel discrepancy types, which can be reported on a pipe-by-pipe basis. These discrepancy types include:
- Individual pipes or bends with yield strength values below the specified minimum yield strength (SMYS) expected by the operator
- Individual pipes or bends with outlying yield strength values that do not fit with the surrounding population
- Populations with an assigned strength grade below the SMYS expected by the operator
- Multiple populations where only one was expected (or, conversely, fewer populations than expected)
- Spatial alignment or boundaries of populations.
With the discrepancies identified and located along the pipeline segment, operators can close out material property verification and re-create Traceable, Verifiable and Complete material documentation.
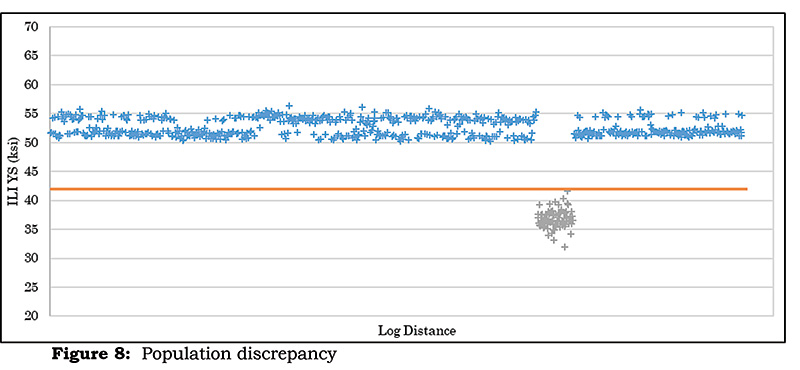
Where records have been lost over time, an operator may wrongly assume all populations or pipe grades within the pipeline are known. An example is shown in Figure 8 where an unexpected pipe population is identified and was reported with strength values and assigned grade below the previously assumed SMYS.
Yield strength values (y-axis) are plotted for each pipe against distance (x-axis), with points color-coded to represent different populations of pipe. The orange line represents the SMYS values provided by the client.
As RoMat PGS reports strength for each pipe in the inspected section, the exact extent of this population is clearly defined in terms of the distance and XYZ mapping.
The operator is therefore able to investigate the location of this discrepancy using satellite imagery to determine, for example, whether it falls in a high consequence area. Digs can then be targeted within this population to investigate the discrepancy further or conduct remedial work within the identified area as required. (Figure 8)
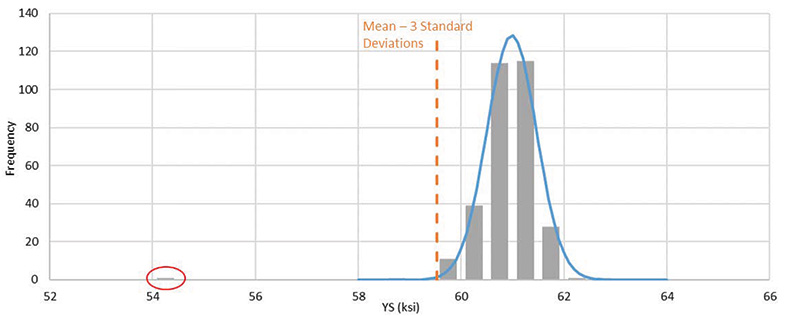
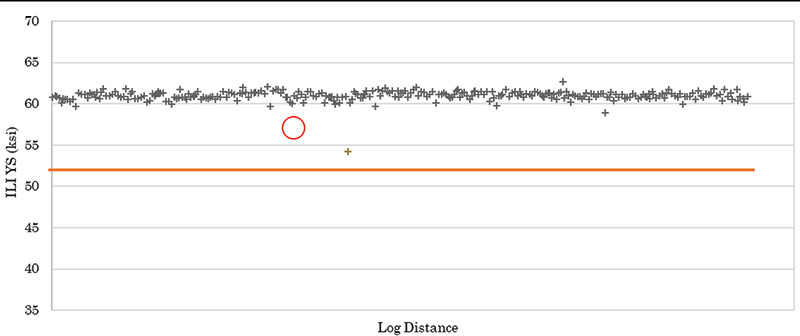
As RoMat PGS reports strength values for each pipe within an inspected section, such outliers can be reliably identified. Figure 9 illustrates where the circled pipe exceeds the assumed SMYS value, but is nonetheless an outlier with respect to the surrounding population.
Shape
By measuring strength values for each pipe within a population, a strength distribution can be established. In pipe manufacture, actual strength values for each pipe tend to follow a normal distribution, and this is reflected in the ILI data. For the population in Figure 9 containing the outlier, the strength distribution as determined by ILI is plotted as a histogram with fitted the normal curve (Figure 10).
Using the parameters of the fitted Normal curve the pipe with reported yield strength of 54 ksi is a clear statistical outlier to the population and therefore a confirmed discrepancy requiring further investigation.
Conclusion
Data is the backbone of our industry. From managing the integrity of the pipelines, optimizing operations, and ensuring regulatory compliance, the demands for a complete and accurate data system have never been more important. Leveraging the approach to increase the confidence in that data offers operators a manageable method to analyze and improve their system of record.
To increase confidence in the digital representation of pipelines, thorough inspection, data analysis and comparison is necessary to identify, investigate and resolve discrepancies. NIMA integrity management software facilitates the alignment and reconciliation of multiple datasets, which can then be stored in a consolidated system.
Once ILI listings are aligned, automated discrepancy listings can be generated using software for a given discrepancy type and displayed visually on charts and satellite imagery to facilitate interpretation by the operator. The operator can use the visual basis to analyze discrepancies by category in the context of the pipeline route and create a prioritized and optimized assessment program for discrepancy types that may pose an integrity threat.
Incorporating revision- or date-controlled functionality means that the discrepancy listing can be updated as discrepancies are confirmed or rectified, with relevant documentation or reports maintained within the software and linked to a specific location in the pipeline. With these tools and analysis results, operators can begin to rebuild confidence within their system of record to support their integrity management, risk mitigation and regulatory reporting programs. P&GJ
Acknowledgments: This article is based on a presentation at the February 2019 Pipeline Pigging and Integrity Management Conference organized by Clarion Technical Conferences and Tiratsoo Technical in Houston.
References
S. Slater and Ollie Burkinshaw, The Role of ILI in the MAOP Verification process, PPIM 2019, Houston, 2019.
National Pipeline Mapping System Operator Standards Manual DRAFT to accompany Information Collection 2137-0596.

Comments