
April 2019, Vol. 246, No. 4
Features
Natural Gas Next-Day Transactions Top 10-Year High, Report Shows
P&GJ Staff Report

The amount of U.S. natural gas traded in 2017 grew for the third year in a row, reaching a level not seen since 2011, according to the latest report by consultants at Cornerstone Research.
In addition, the percentage of volumes, based on Federal Energy Regulatory Commission (FERC) data, showed next-day transactions were at the highest level in 10 years. At the same time, the natural gas fixed-price volume reported to price-index publishers experienced its largest year-on-year drop since 2014.
The Cornerstone report, which focused on FERC Form 552 filings, showed the ratio between index-price transactions and reporting-eligible, fixed price transactions widened during the year.
“In 2017, we had the largest volume of index-priced transactions and the lowest volume potentially reported to indices since the inception of Form 552 reporting,” said Greg Leonard, co-author of the report.
The growth in the ratio was attributed by the report to a 2% rise in index-priced transactions and a 13% decline in fixed-price transactions potentially reported to the indices.
Total reported trading volume on Form 552 submissions rose slightly to 131,296 tBu, transacted by 678 respondents, 33 fewer than in 2016. The 20 companies with the largest volumes of purchases and sales accounted for 44% of total reported volumes.
“As a percentage of Form 552 volume, next-day transactions have been steadily replacing next-month transactions,” said co-author Nicole Moran, senior manager at Cornerstone. “The growing popularity of next-day transactions seems to reflect a change in industry contracting and risk management practices.”
The United States became a net exporter for the first time in almost 60 years as LNG exports grew 8% to 22% of total gas exports in 2017. At the same time, increasing 1% natural gas marketed production hit a record level.
Annual marketed production has remained stable for the last three years, according to the report, rising 1.2% in 2017 and even less in 2016. Marketed production set a record high of 32.476 trillion Btu in 2017.
Additionally, after reaching its lowest level in two decades in 2016, the annual Henry Hub price index rose by 18.7% in 2017. The EIA anticipates Henry Hub spot prices to increase 20% over the next five years.
Top 20 Companies
The companies with the largest total transaction volumes once again showed the U.S. natural gas market continues a pattern of year-to-year consistency as 18 of the top 20 listed were among the previous year’s leaders.
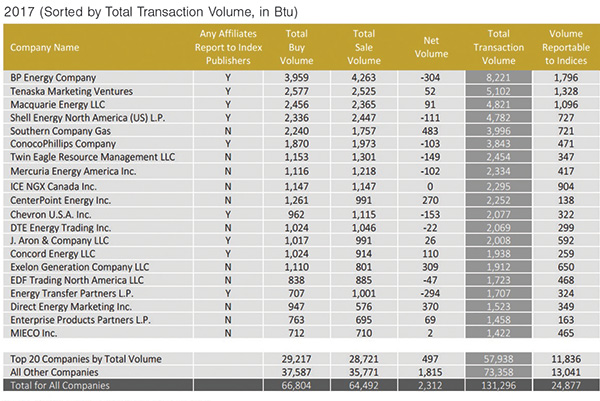
The top 20 companies accounted for 57,938 tBtu out of 131,296 tBtu, or 44% of the volumes reported on Form 552 submissions. Cornerstone said the share is “consistent with recent years,” although it is down slightly from the 2011-2014 average if 47%.
BP Energy had the largest volumes for the 10th year in a row at 8,221 tBtu, a 5% decrease from 2016. The company’s reported level was more than 60% larger than the second-highest trader, Tenaska Marketing Ventures (5,102 tBtu).
Two companies, Chesapeake Energy, ranked 17th the previous year, and Pacific Summit Energy, ranked 20th, dropped out of the top 20. (Chesapeake had not filed a Form 522 by the time the analysis was completed; Pacific Summit landed at the No. 22 spot)
Mieco, Inc., whose parent company is Japanese trading conglomerate Marubeni, and Enterprise Products Partners were new on the list.
LNG Activity
On the LNG front, Cheniere Energy’s Sabine Pass Terminal in Louisiana now has four operating liquefication units. In March 2018, the Cove Point LNG facility in Maryland became the second operating LNG export facility in the U.S. As a result of this and ongoing construction, U.S. liquefaction capacity is expected to triple in early 2020.
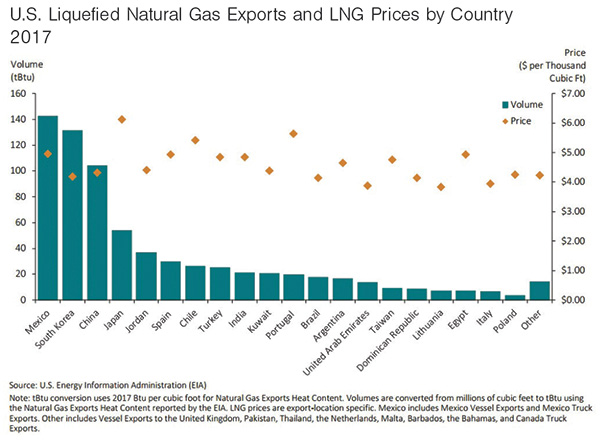
The U.S. exported 707 Bcf of LNG in 2017, increasing its share of exported natural gas 22%, up from 8% the previous year. The remaining 78% was exported through natural gas pipelines. LNG exports to Asia increased to 46% (from 30% in 2016), while Latin America represented 30% of U.S. exports, primarily driven by Mexico.
South Korea increased U.S. LNG exports by 121.1 trillion Btu over 2016, by far the largest increase of any country.
Key points of the report:
- Index-priced transactions comprised almost 80% of all Form 552 transactions.
- Next-month transactions have declined by more than 5 percentage points since 2008.
- For the third consecutive year, companies that chose not to report represented more than half of the reportable fixed-price volume.
- The volume of reported transactions showed that, on the average, a molecule of natural gas was traded through 2.3 transactions from production to consumption.
- The natural gas fixed-price volume potentially reported to price-index publishers saw the largest year-over-year decline since 2014.
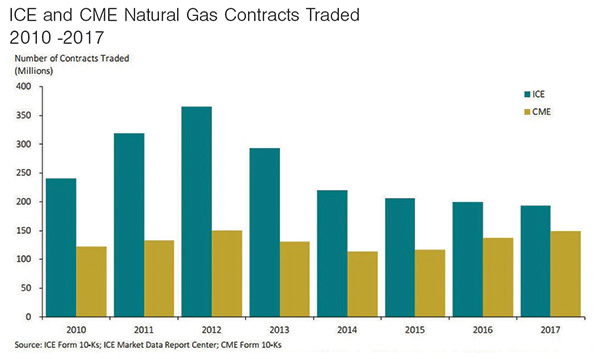
- Aggregate exchange trading of natural gas contracts increased slightly on the two main futures exchanges: CME Group, Inc. (CME) and Intercontinental Exchange (ICE).
- CME’s volume increased for the third year in a row (9%) while ICE’s volume declined 3.5%. P&GJ

Comments