
September 2017, Vol. 244, No. 9
Features
Managing Liquid Pipeline Risk Through Drinking Water USA Assessment

You sit across from the salesman, smiling – ready to close on the car of your dreams. Concerned about affording upkeep, you opt to purchase an extended warranty. The warranty is meticulous. As you read through it you notice that it covers, among other things, a cassette deck, a timing chain, cigarette lighters, and a carburetor. But this is 2017 and your dream car has none of these.
The car does, however, have a navigation system, backup cameras, USB ports, and electronic fuel injection. Not one of these items is listed in the warranty. Your smile drops to a look of concern and you ask the salesman for an explanation. He tells you that the warranty was written 20 years ago, and although the company intended to update the contract every few years, they never got around to it.
Your concern turns to incredulous amazement. “Look,” you tell him, “I don’t mind paying for an extended warranty. In fact, it’s important to me to protect all the bells and whistles that come with this dream car. Your warranty doesn’t do that! And, it looks like I’m paying for risks that don’t even exist on my car.”
HCAs and USAs
High-consequence areas (HCAs) are locations which could suffer significant negative impacts from released pipeline product. HCAs include two categories of densely populated areas, navigable waterways and unusually sensitive areas (USAs). USAs include ecological and drinking water resources.
There are regulations in the Code of Federal Regulations (CFR) 40, Part 195 for managing and operating hazardous liquid pipeline segments that could potentially affect an HCA if a “worst-case” release occurred. These regulations set requirements for additional assessment, monitoring, and maintenance, compared to a pipeline that would not impact an HCA during a worst-case release. The additional activities are required so that there is an extra level of protection to the HCAs.
Depending upon pipeline, product, and geographic characteristics, potentially affected HCAs may be adjacent to a pipeline or 10 of miles away. Although highly variable, the annual additional cost, per mile, to manage and operate pipeline segments that run through or could affect an HCA is typically thousands of dollars or more. And, the liability associated with not adequately protecting an HCA is orders of magnitude more.
Unfortunately, standard practices for identifying and defining USAs can be like purchasing a car warranty that is 20 years older than the vehicle. If not prudent, pipeline operators may spend lots of money protecting non-existent risks while not having adequate protection for the largest potential liabilities.
Drinking Water USAs
Drinking water USAs include a limited number of especially vulnerable aquifers (underground supplies of water) that are the primary source of drinking water for an area. Drinking water USAs also include numerous public water supply intakes at surface water bodies (typically reservoirs, rivers, and streams) and groundwater supply wells.
For many pipeline systems, drinking water USAs account for the greatest mileage of pipeline that is managed under HCA regulations. Because of the health and livability concerns that would occur if a public water supply was impacted, most would agree the money spent to protect drinking water is a good investment. Likewise, when remediation and replacement costs can quickly and easily reach millions of dollars, most would agree that not adequately protecting a drinking water supply is risky business.
Each public drinking water supply USA includes a point (intake or well) and a buffer/protection zone around the point. If the USA (i.e., the center point and surrounding buffer zone) could be impacted by a worst-case release from a pipeline, the pipeline must be managed as an HCA pipeline. So that both drinking water resources are protected and that the expense of managing the HCA pipeline is a real investment, it is crucial that drinking water USAs are accurately identified and appropriately buffered.
Pipeline Mapping
The National Pipeline Mapping System (NPMS) includes a database of historic drinking water USAs and associated buffer zones. The historic drinking water USA data is available to pipeline operators from the Department of Transportation, Pipeline and Hazardous Materials Safety Administration (PHMSA).
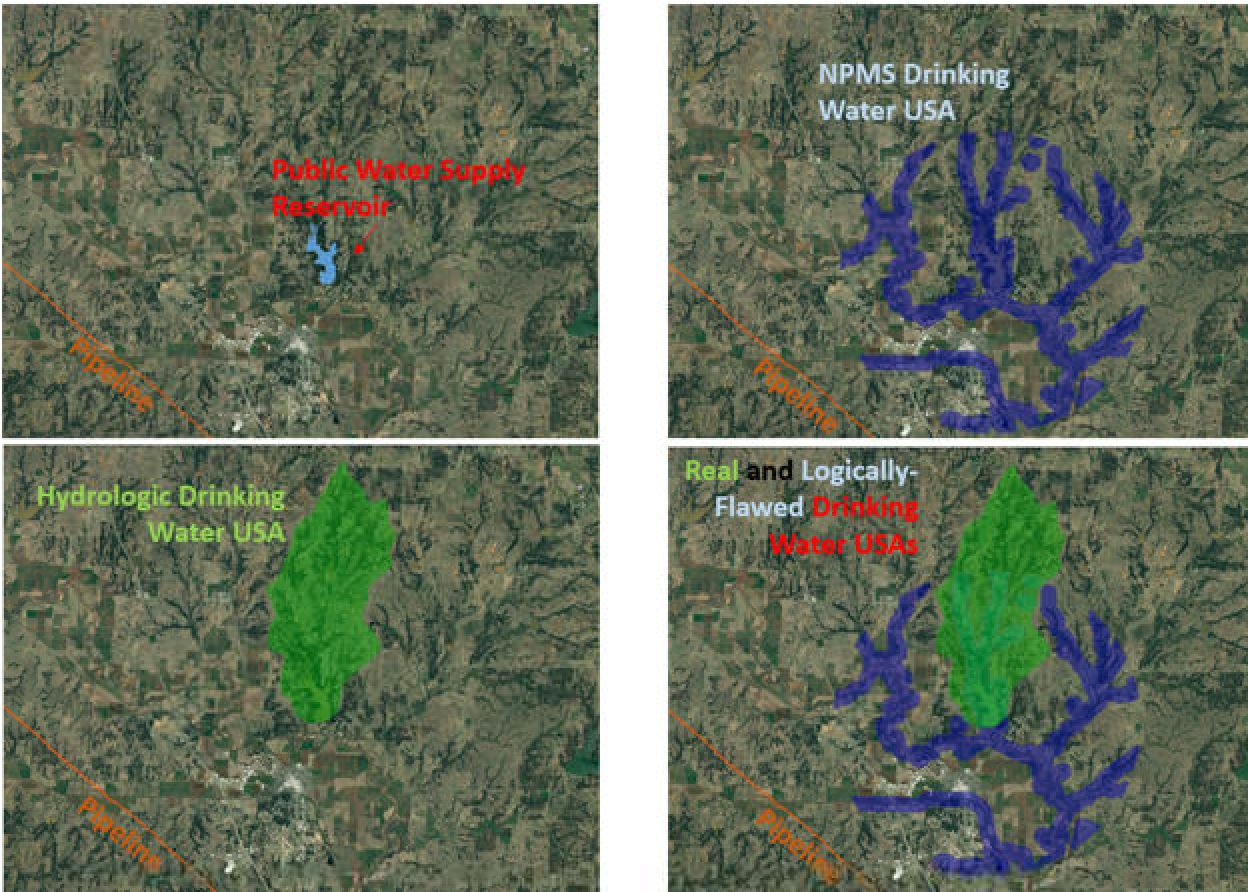
The historic drinking water USA data points use uniform buffer distances to create large protection zones around wellheads and drinking water intakes. The NPMS default buffer zones typically include a set radius of 5 miles around surface water intake and locally set radii around groundwater wells. The locally set radii, ranging from 0.1 miles to over 2 miles, each apply to an entire state or a large portion of a state.
The buffer area for surface water intakes includes all of the topographically low areas within the radius. The buffer area for groundwater wells is all inclusive. This reliance upon using a uniform geometry for buffer shapes and predefined radii may result in unreasonable and unsound drinking water USAs.
The buffer zones typically contain areas that are not related to and could have no impact upon the real drinking water resources. The buffer area sizes for groundwater wells are geographically based and do not consider well construction, local geology, or aquifer characteristics – important characteristics that influence susceptibility of a well to contamination from a pipeline release.
More importantly, because the NPMS data are historic, they often do not accurately portray current public water supplies (i.e., drinking water USAs). Most NPMS Drinking Water USA datasets were:
- Collected in 2001
- Published in 2002
- Contain public water supply data published by states during the early to mid-1990s, and potentially gathered well before publication dates.
- Intended to be updated at least every five years, but that has not happened.
Extensive experience with USA assessments indicates that NPMS drinking water data:
- Misses many public water supplies, including all installed since the late 1990s
- Includes historic public water supplies that are no longer used
- Includes some groundwater wells that appear to have never been public water supply wells
- Includes public water supplies that appear to be inaccurately mapped (possibly plotted in the wrong coordinate system).
Many pipeline operators utilize the PHMSA USA database as their sole source for identification of drinking water USAs. If a modeled “worst-case” release intersects an HCA (including these historic and inaccurately mapped USAs), operators designate that portion of pipeline as “in or affecting an HCA.” If a modeled release from the pipeline does not reach a USA or another HCA, no designation is assigned.
This practice of using only NPMS data to assess drinking water USAs/HCAs results in the inclusion of inappropriately designated buffer zones, the likely exclusion of public water supply from appropriate protection, and non-compliance with CFR 49, Part 195, which states:
“An operator, member of the public or other government agency may view and download the data from the NPMS home page … However, it is an operator’s responsibility to ensure that it has identified all high consequence areas that could be affected by a pipeline segment. An operator is also responsible for periodically evaluating its pipeline segments to look for population or environmental changes that may have occurred around the pipeline and to keep its program current with this information.”
Better Methodology
Luckily, accurate and detailed public water supply and complementary data are publicly available from state environmental regulatory or water development agencies. This data facilitates assessment of NPMS data sets and also the identification of current drinking water USAs. The state-reported locations of the public water supplies can be verified using geo-referenced, high-resolution, publicly available aerial photographs and maps through private (i.e. Google) and public (U.S.G.S) webpages.
Most states plot the location of the intakes for public water supplies. Some such as Oklahoma, have defined sophisticated protection areas around the intakes, using engineering design for each specific water supply as well as the physical characteristics of the water resource and surrounding area.
While defining drinking water USAs in states without well-developed protection areas around intakes, operators can use engineering and environmental data about the public water supplies to develop algorithms and calculate risk-based protection areas/buffer zones around the intakes.
For groundwater wells, the following information is available in many states:
- Well age
- Well depth
- Well construction details (casing, seal, etc
- Soil and bedrock characteristics
- Groundwater depth
- Groundwater flow directions
- Subsurface geology, including confining layers above the aquifer being exploited.
Using this information, operators can develop buffer zones for public water supply wells that are based upon each well’s susceptibility to impact from a pipeline release.
For surface water drinking water USA data, operators can use the surface topography and drainage patterns apparent from maps and aerial photography to define hydrology-based buffer zones as those areas that could impact a drinking water intake. These are generally constrained to the upstream portions of the drainage basin.
Risk Management
The differences in drinking water USA assessments using current public water supply data with science-based buffer compared to NPMS data is striking. On behalf of an operator, we recently assessed an approximately 80-square-mile area in the Shawnee, OK region. Within that area, NPMS identified six drinking water USAs. Although listed as public water supplies in 1996, none of the wells are now used for drinking water. The seven public water supply wells that are being used are listed in a geographically different portion of the Shawnee metropolitan area than the historic wells. Reliance on the NPMS drinking water USA data for a HCA analysis would have resulted in the operator providing added protective measures for defunct public water supplies and insufficient and non-compliant protection for current drinking water resources.
HCA analyses are models and models are only as good as the data they include. If drinking water USA data is not current, the resultant HCA model run will likely miss real liability areas while prescribing protection for resources that no longer exist. That’s like paying good money for a bad warranty!

Comments