
March 2017, Vol. 244, No. 3
Features
Using Inline CP Tools in Multiple Pipeline Corridors

Many operators have adopted performing close interval surveys (CIS) on routine intervals to assess cathodic protection (CP) effectiveness over a length of pipeline at a high-resolution level. This technique measures and records the pipe-to-soil potential of the pipeline at consistent spacing of typically between 1-3 meters.
In the past several years, the accuracy of close-spaced CP surveys has dramatically improved through the application of modern electronic data sampling and logging in conjunction with global positioning system (GPS) synchronized current interrupters. However, coinciding with these advancements, new challenges have arisen from the expanding needs of Enbridge’s shippers and subsequent system capacity enhancements. Expansion has resulted in instances in which up to seven parallel pipelines are contained within the same right-of-way (ROW) of the mainline corridor.
The ROW now includes several pipeline combinations of various diameters, coating types and current demands, all connected with common CP systems. Such complex ROW arrangements, and the use of horizontal directionally drilled (HDD) construction techniques, have made ascertaining pipeline specific CP levels much more difficult, particularly when using conventional monitoring techniques. There is a relatively new inline inspection (ILI) technology available that can assist in overcoming this dilemma.
The ILI CP tool measures the true electrical current patterns on the pipe that originate from a CP system or interference source. The current flowing in the pipe wall (axial current flow) can be measured by the Baker Hughes CPCMTM ILI tool. The CP current measurement tool inspects piggable pipeline sections while the CP system is in normal operation.1
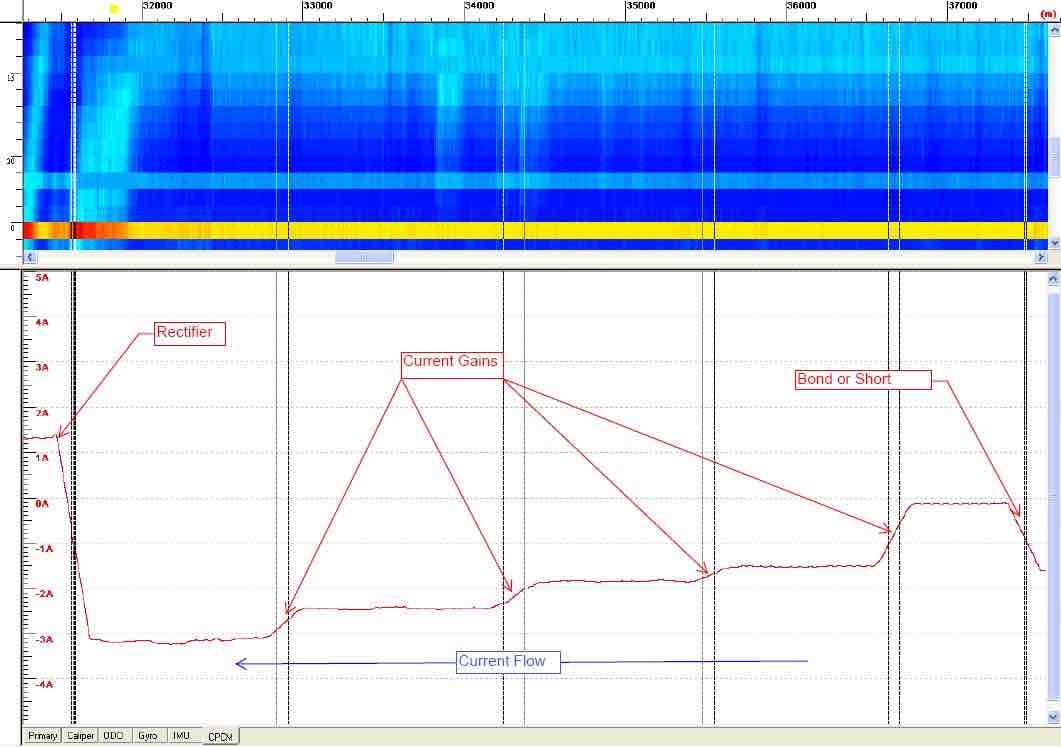
The tool accurately measures the potential drop in the pipe wall caused by the flow of CP current while traveling at a speed of 1-2 mph. The potential drop is converted to axial current flow values through the use of Ohm’s law, I = E/R. The resulting current values are then plotted against pipeline footage. Analysis of these graphs allows for discreet identification of areas along the pipeline having varying current density (Figure 1).
The integrity of a buried pipeline is decidedly dependent upon effective CP performance. The status of the CP system must be routinely assessed using data often collected by various means and methods. Unnecessary and costly repairs or, in the worst case scenario, failure can result from basing decisions on erroneous data. Therefore, determination of CP effectiveness requires not only skilled analysis but also accurate information. ILI CP provides another dataset detailing the pipeline and CP system interaction that has been unavailable until now.
Standard application of CIS CP monitoring techniques can return inconsistent results in multiple pipeline ROW situations. It is generally recognized that CIS along multiple pipeline corridors yield ON potentials that are a mixed, or geometrically averaged potential of some or all of the pipelines having proximity to the reference cell. Similarly, OFF potentials may include sources of error associated with a rebalancing of potentials between protected structures, each having different levels of polarization.
The cathodic/anodic current exchange between multiple pipelines may not stabilize within the typical OFF cycle of an interrupted survey to provide enough opportunity for obtaining a valid polarized value. An accurate and reliable OFF potential measurement is essential to evaluate CP effectiveness of the pipe when applying the -850mV CSE copper sulfate electrode (CSE) or 100mV polarization/shift criteria1. Several factors can influence ON and OFF potential measurements including2:
- Voltage drops through the soil
- Foreign-generated DC currents
- Capacitive effects
- Chemical environment of the soil
- Current generated from dissimilar levels of polarization between the electrically continuous structures.
In addition to influence from adjacent pipelines, errors can arise from transition areas having drastically different soil properties, coating type or environmental condition changes. Locations with higher impedance, due to soil properties or defect geometry, may not always be appropriately characterized in collected CIS data.
Alternating current (AC) mitigation systems must also be considered when planning a CIS survey. When the CP current is interrupted on a pipeline equipped with decoupling devices, the voltage across each decoupler must change by the magnitude of voltage drop eliminated. Transient current will flow as voltage change occurs across the decoupler. An erroneous OFF value will exist until dissipation of the transient current measurement has occurred.
To have confidence in the CP status being reported, it is imperative that all survey locations are correctly classified as “adequate” or “sub-criterion.” Consequently, extremely stringent and often impractical or unattainable survey controls must be implemented in multi-pipeline corridors for CIS surveys to sustain the degree of accuracy necessary for realistic representation of conditions. Unless such controls can be clearly achieved, it is important not to rely solely on CIS profiles when assessing the effectiveness of CP in a multiple pipeline corridor.
Although the CP ILI option is not disposed to the complications associated with collecting CP data through CIS as aforementioned, it is not without its own inherent set of limitations. Launch/trap facilities must already exist or be installed on the pipeline, and operation may be temporarily adjusted to accommodate the inspection. The tool is sensitive to product type, speed, temperature and pressure, so not all operating conditions may be compatible for the assessment.
Newly constructed pipelines with heavy internal mill scale will limit electrical contact and compromise measurement ability. Accordingly, a very clean pipeline interior surface is necessary to sufficiently collect information. The premise for data acquisition is based on measuring the potential difference between contact sensors situated at the extremities of the assembly. Therefore, high-efficiency coated/low-current demand or large-diameter/heavy wall pipelines can be problematic if the resulting voltage drops are below the tool’s detection capability. Considerable amounts of electrical noise can result from contact wheels running along spirally welded pipeline long seams. Other factors that introduce roughness to the interior of the pipe, such as seamless pipe, may increase electrical noise levels and degrade data quality. CP ILI technology does offer some distinct advantages when compared to CIS:
- Inspection time is reduced to hours or days
- Data reports are typically provided in less than 60 days
- Interrupters are not required
- Landowner notification and ROW preparation is eliminated
- Data is more repeatable
The ILI CP tool measures the true electrical current patterns on the pipe that originate from a CP system or interference source. From the resultant high-resolution (readings every 2.5 mm), pipeline-specific data set, there is further opportunity to expand the capability of analysis. Powerful modeling software is available which can simulate the electrical/electrochemical processes happening at the pipe metal surface based on the current flowing from the soil onto the pipe wall. One primary limitation of previous models was the inability to accurately represent the coating quality along the length of the pipeline.
Assumed values were typically used, often leading to inaccurate models. Current density is directly proportional to coating quality; therefore, current density data from the CP ILI tool can be used as a primary input for such modeling simulations to predict pipe-to-soil potentials. This combined approach offers the benefit of having a model that characterizes the actual conditions of the pipeline using minimal assumptions.
It is essential to have an adequate model that describes the performances of the CP system and the real pipeline behavior. The modeling software is capable of calculating:
- Voltage drop-free potentials at pipe-to-soil interface over the full pipe route
- ON and OFF potentials at different soil grade levels
- Axial current flow in the pipe wall
- Local current density
- Rectifier voltage
Results
The portion of mainline pipeline system that is the subject of this study can be characterized as outlined (Table 1).

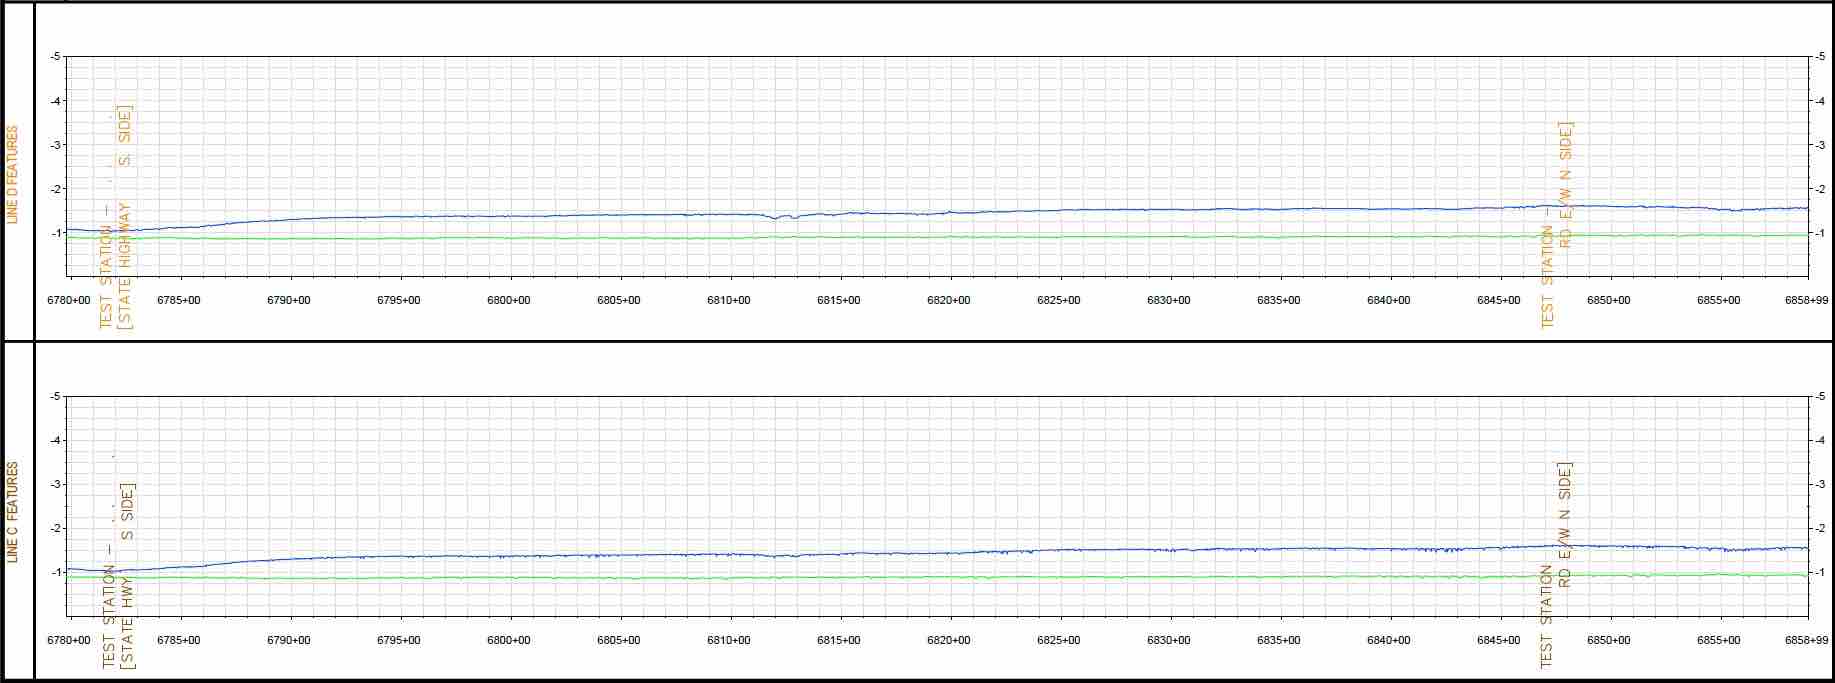
A CIS was conducted on both Lines C and D in 2011/12. Figure 2 represents a 1.5-mile (2.4-km) sample of the typical profiles obtained from the work. Apart from some subtle distinctive trends, the two profiles pertaining to Line C (bottom) and Line D (top) are markedly similar in protection levels.
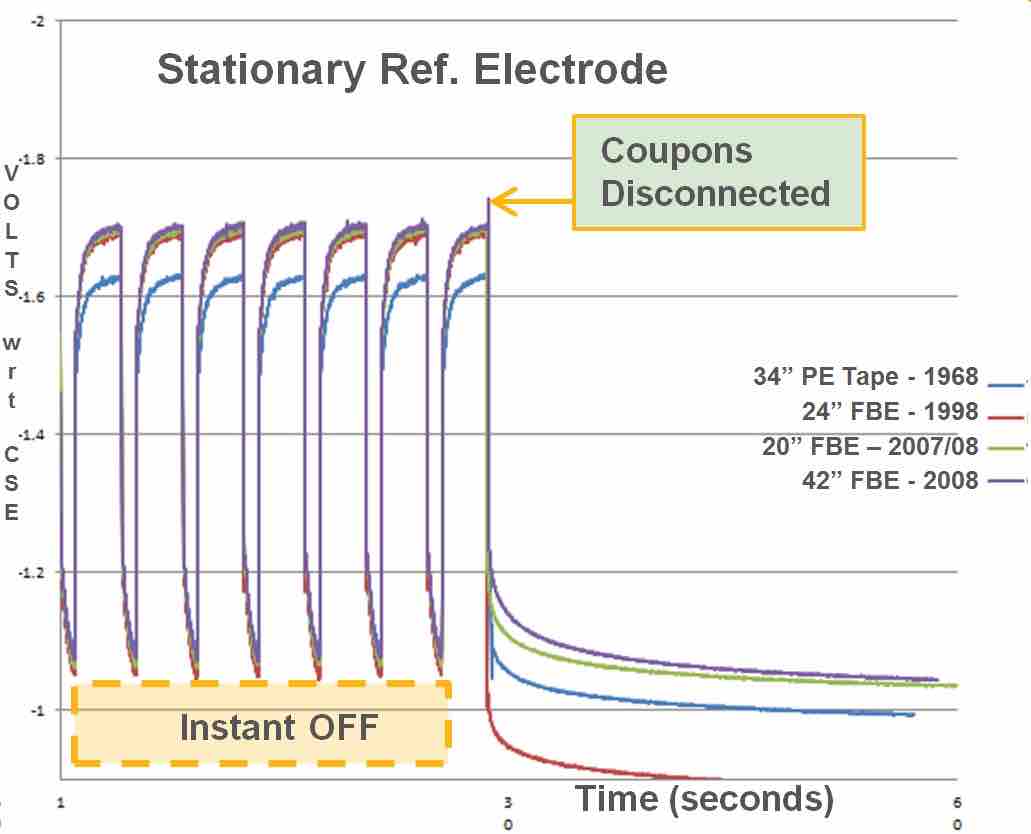
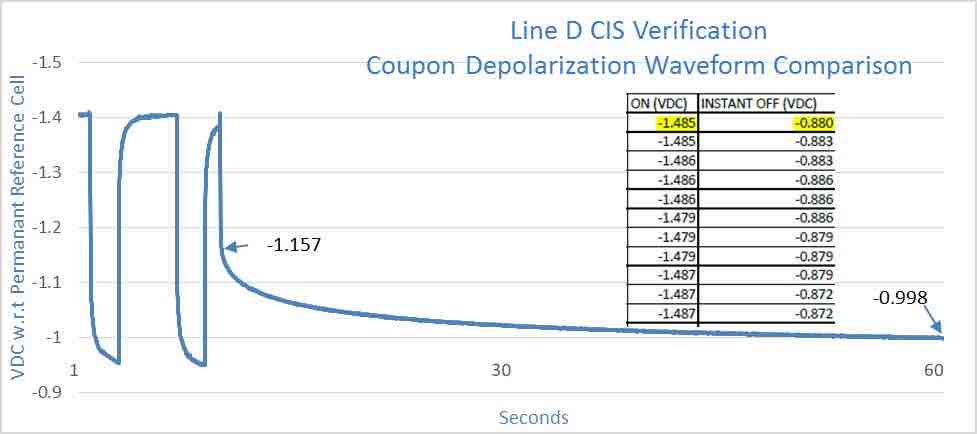
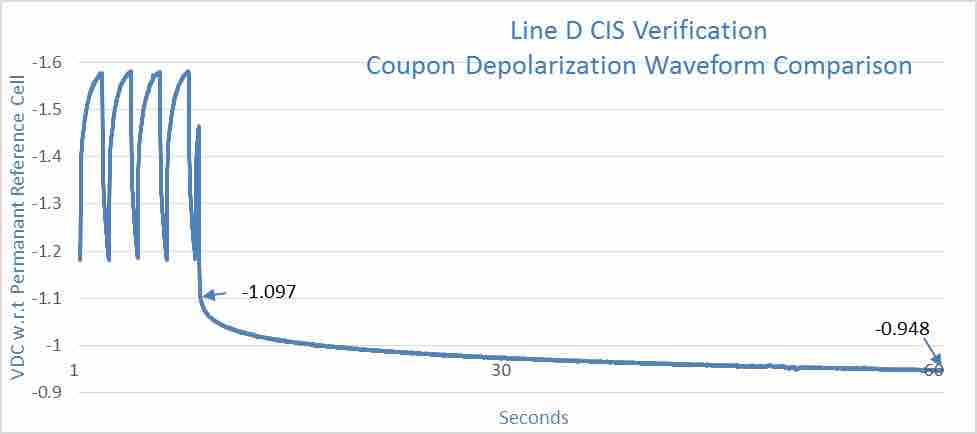
In 2014, a comprehensive CP coupon installation program was initiated to increase understanding of protection levels pertaining to specific lines within the corridor. The following information (Figures 3 and 4) corresponds with the downstream test station location contained (Figure 2). Each of the following data sets was sampled with duration of 60 seconds and recorded at a frequency of 60 measurements/second (3,600 data points/graph). Both figures demonstrate the change in pipe-to-soil potentials once the coupon is physically disconnected from the pipeline at the 30-second interval of the test.
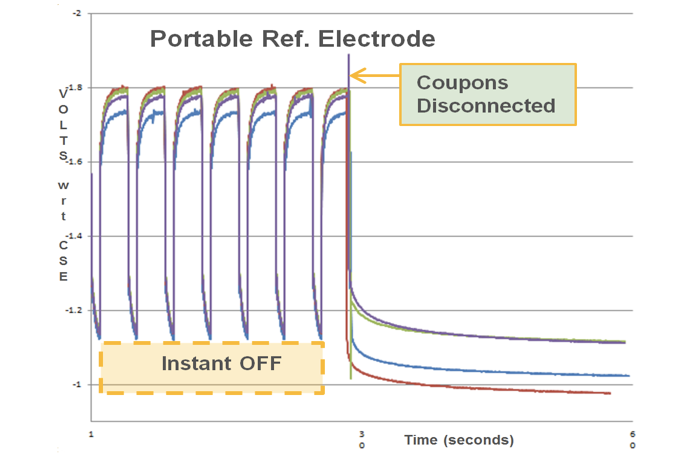
The potential inaccuracies associated with performing a CIS through this region are clearly demonstrated from Figures 2 and 3. Consistent with Figure 2, OFF values would be recorded as being quite similar from line to line, with a maximum disparity of approximately 75mV from the highest and lowest protection levels. However, true polarization of the structures is not fully realized until the coupon has been electrically disconnected from the network. Some degree of error remains evident within the data acquired by the portable reference electrode through comparison of the two profiles. In this case, the measurements made from grade level depict a more optimistic level of polarization.
Subsequently, further investigative efforts were made to comprehend the level of legitimacy in the data and improve interpretation of actual conditions. In 2014, 32 distinct segments on Line D were selected for CIS resurvey, ranging from 60m to 12.5km in length. The sections were selected based on location, previous results and coupon availability. The results did not exhibit any consistent trending other than repeated discrepancy in coupon and CIS measured values. Figures 5 and 6 exemplify the contrast in the data obtained from the CIS survey (highlighted) and corresponding coupon data sources of methods.
The data indicates that CP under-calls or over-calls can be reported by CIS data, particularly through multiple pipeline corridors. Additionally, electrical communications continue between the pipelines within the mutual ROW throughout the “open-circuit” portion of the interruption cycle, at which point all CP current sources have been temporarily suspended.
CP inline inspection was performed on Lines B and D. Line D was surveyed for its entire length of 742 km (461 miles), while 294 km was obtained for Line B. Figure 7 shows the line current profile obtained by the tool. Both pipelines originate in the same ROW but Line B diverts from the common ROW after 518 km (321 miles). The section where CP ILI data is available for both pipelines is between 446-518 km (277-321 miles).
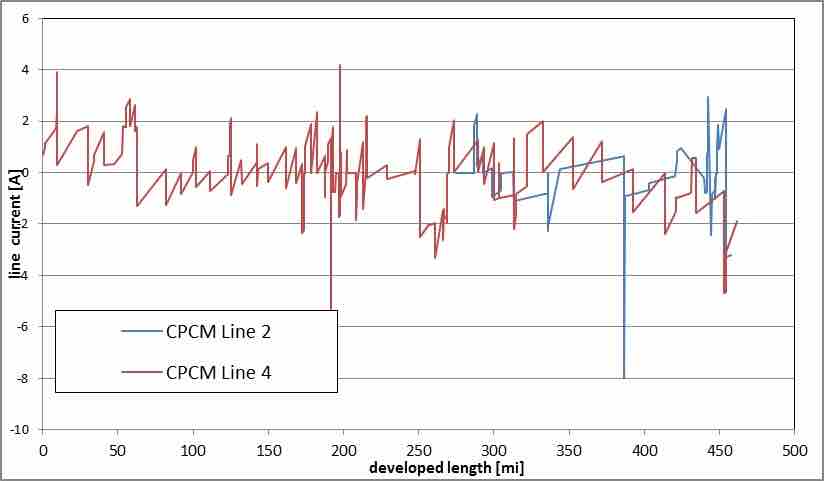
The following was determined from the model based on the information contained in Figure 7:
- Both lines behave completely different in the ROW attributed to variances in installation.
- The region between MP 190 and MP 201 was atypical and warranted further investigation.
- The large negative current peak (-6 amps) in Line D coincides with the rectifier at MP190 while the large positive peak (4 Amps) coincides with the rectifier at MP196. It was determined that a grounded structure was inadvertently connected to the pipe at those locations, influencing CP current flow.2
Conclusions
The industry no longer faces the dilemma of data rationing, but rather one of effective management and use of the massive, readily obtainable information sets. Accordingly, caution must be exercised during the data acquisition process, as there are many opportunities to record erroneous information pertaining to the level of CP on pipelines. This is particularly the case when attempting to capture representative polarized or instant “OFF” potentials. The impedance of the measured structure defines the magnitude of the measured potential and influences the distribution of the CP and stray currents. Although modern electronics have the capability to capture very precise CP measurements, accuracy cannot be guaranteed from equipment alone.
CP survey locations may be incorrectly classified as “adequate” or “sub-criterion” due to errors in the measurement process. For decades, CP criteria has been an enduring issue, exhaustively scrutinized, studied and debated; however, it continues to remain challenged as external corrosion is repeatedly and persistently discovered.3 Perhaps some of the controversy should not necessarily be attributed to questionable or invalid criteria, but rather the result of erroneous field information having been applied. Therefore, awareness of such errors is imperative and gathering of accurate field measurements is critical for subsequent use as input for modeling and simulations.
CP ILI technology is available that allows pipeline sections to be accurately inspected in a single run at productive rates (few miles per hour). The local axial current flow in the pipeline is measured while the CP system is in normal operation. These measurements can be further translated by modeling software into values for the most relevant CP parameters including current density, pipe-to-soil potentials and coating resistance.
This approach allows operators to cost-effectively and accurately assess the CP performance in multiple pipeline corridors with a minimal level of field effort and less susceptibility to measurement error. The capability of computer modeling applications has progressed significantly to the point where sophisticated and realistic simulations can be generated from powerful computational algorithms which incorporate a multitude of variables.
Acknowledgments
The authors would like to recognize and thank Enbridge Liquid Pipelines’ Mike Hill, Yvan Hubert, Kurt Baraniecki and Walter Kresic for their support, dedication and devotion toward advancing pipeline integrity management.
References
1Janda, D., Baete, C. (2012). “A New Approach to Pipeline Integrity – Combining In-Line Inspection and Cathodic Protection Simulation Technology.” Corrosion 2013; Paper No. C2013-0002239. NACE International.
2Krissa L., DeWitt, J., Baete, C. (2015). “CP Management of Multiple Pipeline Right-of-Ways.” Corrosion 2015; Paper No. C2015-0005795. NACE International.
3Gummow, R.A. (2012). “Would the Real -850 mV CSE Criterion Please Stand Up.” Corrosion 2012; Paper No. C2012-0001347. NACE International.
Disclaimer
Any information or data pertaining to Enbridge Employee Services Canada Inc., or its affiliates, contained in this article was provided to the authors with the express permission of Enbridge Employee Services Canada Inc., or its affiliates. However, this article is the work and opinion of the authors and is not to be interpreted as Enbridge Pipelines Inc.’s, Enbridge Employee Services Canada Inc.’s or their affiliates’ position or procedure regarding matters referred to in this article. Enbridge Employee Services Canada Inc. and its affiliates and their respective employees, officers, directors and agents shall not be liable for any claims for loss, damage or costs, of any kind whatsoever, arising from the errors, inaccuracies or incompleteness of the information and data contained in this article or for any loss, damage or costs that may arise from the use or interpretation of this article.

Comments