
March 2017, Vol. 244, No. 3
Features
Applications of Relative Calibration of Crack and Corrosion ILI Data

Inline Inspection (ILI) tools are periodically employed for pipeline inspections using two types of technologies: magnetic flux leakage (MFL) and ultrasonic testing (UT). These tools assist in detecting, sizing, and locating corrosion, crack, and deformation features. The evaluation of ILI performance is usually based on trending field measurements and ILI data (unity plot). Enbridge, as an industry leader in applying innovative processes and technologies in pipeline threat management, has conducted work on developing methodologies to improve the uncertainty quantification of tools’ measurement.
This work brings an opportunity for pipeline operators and ILI vendors to include the uncertainty of both ILI and field measurements and calibrate ILI results. The calibrated ILI data can potentially impact integrity mitigation programs in terms of increasing the safety of the pipeline or reducing unnecessary integrity actions. This can directly influence the number of digs predicted based on a calibrated ILI program.
Last but not least, the probability of failure (PoF) of the line can be potentially affected by the calibrated dataset if the tool performance was under-calling or over-calling. Calibration corrects this.
Every measurement has some inherent uncertainties that can skew the measurement from the true value. There has been a previous work to estimate the uncertainty of the ILI data using the field measurements 1, 2, 3. The true value can never be determined with total certainty, but it can be estimated using two measurements (ILI and field). Herein, ILI and field-trending assumes a linear relationship between ILI and field measurement. Based on this, it can be reasonably assumed that there is a separate linear relationship between the true value and ILI measurement and another linear relationship between true value and field measurement.
The relative calibration of ILI data is based on calibrating the ILI data relative to the field data. The calibration parameters are obtained from the unity plot that includes both ILI and field data. Therefore, false negative and false positive data points are not included in the calibration process. In this article, the ILI data are calibrated relative to the field data using advanced statistical methods 2, 3, 4, 5 and the application of calibrated ILI data for both corrosion and crack-inspection programs is discussed.
Due to the nature of the problem in hand, the proposed calibration methodology has limitations and benefits that are unique for each ILI program. Hence, a guideline for implementing the proposed methodology is required in order to understand how to interpret the results and avoid compromising the safety of the pipeline due to statistical limitations. For corrosion threat, ILI and field data are trended for both depth and rupture pressure ratio (RPR) in order to assess the performance of the ILI data and calibrate the remaining features on the pipeline.
While depth calibration is performed directly on the collected data, the RPR calibration can be performed directly or indirectly. For crack threat, the calibration process is approached differently. The crack depth trending analysis is performed on the field and ILI data; however, the calibration methodology does not hold directly in this case due to the lack of a linear relationship between ILI and field data. It was shown that calibration using the safety factor or failure pressure, as an indirect measurement, provided more reasonable results. All the methodologies/approaches proposed here are demonstrated using real data from inspection cases.
Methodology
The proposed calibration methodology assumes a linear relationship between true ILI and field measurement as shown in Equation (1).
![]()
Where MILI is the measured value by ILI, is the measured value by field, and and are intercept and slope parameters respectively for the ILI and field linear relationship. Both ILI and field readings are contaminated with measurement errors; hence, the following relationship (equation (2)) exists between ILI and field measurement readings:

Where, the measurement random errors of the ILI and the field are and respectively. In this linear relationship, depth of defect measured in field () is considered the independent variable and depth of feature reported by ILI () is the dependent variable. This linear relationship between the ILI and field suggests there are two distinct linear relationships: one between the true maximum depth and the ILI peak depth, and another between the true maximum depth and the field maximum depth (shown in the equations (3) and (4)


There are several methodologies developed to improve the accuracy of estimated true measurements, based on two independent tools which are based on linear regression, including Errors-In-Variables (EIV) 2 and Wald grouping method2. In addition, there are numbers of methodologies that can improve the precision of the ILI data including Grubb’s estimator3, 4, maximum likelihood (MLE)3, constrained maximum likelihood (CMLE)3, and constrained expected likelihood estimation (CELE)3. Earlier, a variation of Jaech’s methodology was developed that was used for the simulated corrosion depth trending dataset2.
In this work, all these methodologies are used to assess the uncertainty of ILI and field measurements; however, the chosen methodology for calibration has been selected based on higher accuracy (i.e. mean error close to zero) and then higher precision (i.e. smaller standard deviation of the error). The calibration methodology used here is based on an earlier adopted work to include the measurement uncertainty to estimate the true depth5, 11.
The calibration model parameters check is included in minimum number of data points, linearity checks, normality checks, constancy of error variance and normality tests6, 7, 8, 10. Once all these checks were completed, the calibrated ILI data is recommended for one set of inspections.
Applications
Relative calibration of ILI data has several benefits that can immediately affect integrity safety and resources during pipeline operations. If ILI and field-trending demonstrates an under-calling or over-calling of ILI data with respect to field, (e.g. the depth of ILI features are sized shallower or deeper than the corresponding field depth), this can impose a safety or resource issue without addressing the ILI performance. In dig forecast, using the detected features and estimating the timeline that a feature reaches the critical depth is a common practice.
The feature growth is estimated using a corrosion growth rate model [9]. The performance of an ILI tool run can directly impact the corrosion growth rate and finally the forecasted grown feature. In this section, examples demonstrate the calibration application.
Figure 1 shows the tool performance of ILI corrosion MFL program over-calling compared with field depth (trending unity plot). After implementing the calibration over these values, the ILI performance can improve both accuracy (close to zero mean) and precision (tighter standard deviation) of the measurement. The methodology with the highest accuracy (distribution mean closer to zero) and highest precision (smaller standard deviation) are recommended for this. In this example V-Jaech methodology has performed well compared to the other methodologies for this calibration (Figure 2).

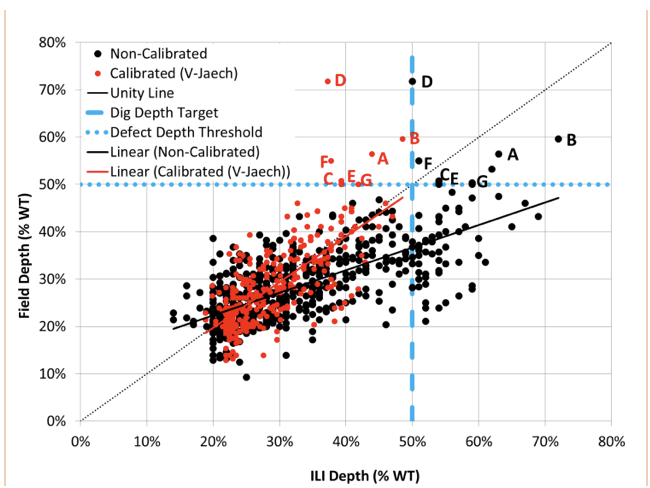
There are a number of ILI features (Figure 2) that met the excavation criteria; however, after calibration, the corrected depth was shown to be shallower so therefore the feature no longer meets the depth-excavation criteria. Some of these features have been found to be deeper during field inspections and met the dig criteria. Hence, one could see that the calibration results may lead to safety issues for the pipeline. Table 1 lists such features along with their ILI description. These features are considered outliers to the calibration process.
Table 1: List of outliers features.

The ILI tool sizing and detection ability varies based on morphology and position of the feature with respect to weld. All the outliers above are within 20% NWT sizing ability of the tool due to location close to the weld or the morphology (axial slotting or pinhole). These findings emphasize the need to develop an additional guideline on how to use the calibration process in addition to the detailed statistical approach. The guideline should protect the integrity engineer from using the calibration results blindly.
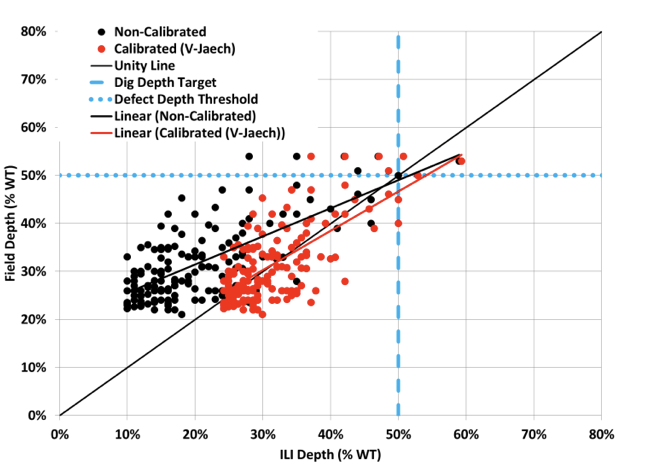
Similarly, another ILI tool performance can be shown under-calling relative to the field depth (Figure 3). For this example the V-Jeach methodology shows excellent uncertainty estimation for calibrating of ILI data relative to field data. The unity plot for calibrated and non-calibrated data points is shown in Figure 4.
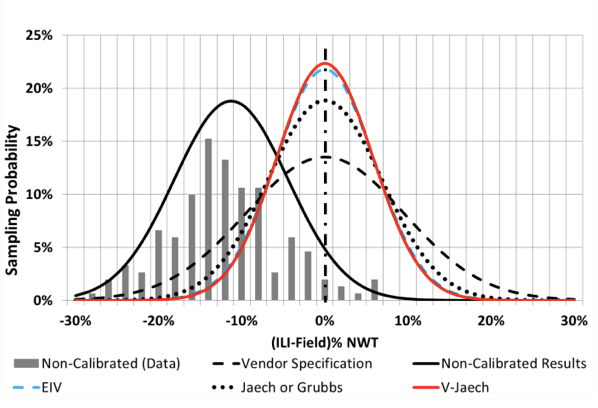
Figure 3: Corrosion depth measurement performance for under-calling ILI.
Consider a feature with a depth of 50% NWT measured by the above-mentioned MFL ILI run and with ILI performance that showed over-calling. This feature is calibrated to the depth of 37% NWT. Considering another feature with a depth of 46% NWT for the ILI tool run with the under-calling performance, this feature is calibrated to the depth of 50% NWT. Both these features shown in Table 2 may raise safety and resource issues for the threat management of the pipeline. This change in the depth of the reported features by the ILI measurements can change the dig forecast. In corrosion programs, this can impact the corrosion growth rate for the active corrosion features. Calibrating depth can affect the leak limit state (LLS), which will be discussed later.
Table 2: Comparison between non-calibrated and calibrated data of measured feature by ILI MFL corrosion run.

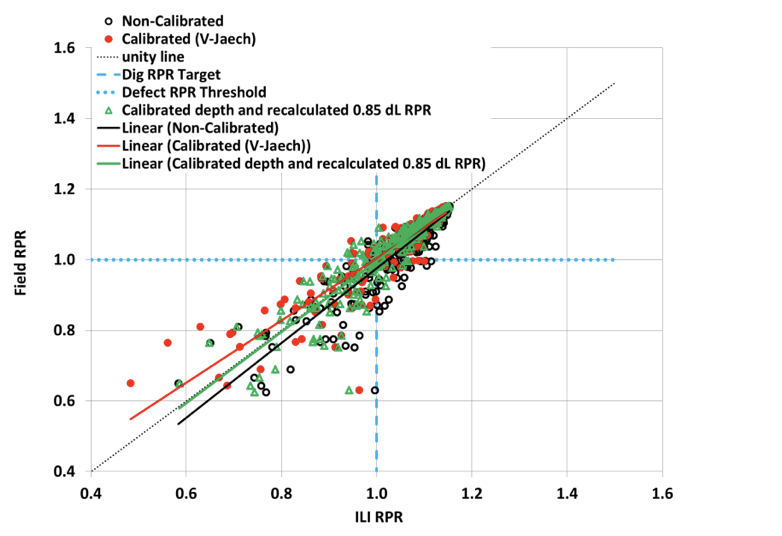
Calibrating the corrosion ILI data for RPR values can be performed similar to the depth. The calibration can be implemented directly to the trended RPR values calculated by ILI and field or it can be used to calibrate the depth separately and recalculate the RPR based on calibrated depth. The calibration of RPR (Figure 5) uses both methodologies. In this example the recalculation of RPR was completed using B31G after depth calibration and using the field defect length for both ILI and the field.
Pipeline structural reliability has always been a topic of interest to pipeline integrity analysis. In recent years, this direction has been advanced with the ultimate goal of zero failures in Enbridge Pipelines’ system. One of the most important reliability measures is the probability of failure (PoF) of a component (e.g. pipe joint) or a system (e.g. segment or line). Herein, PoF calculations are based on data collected from ILI tools.
The accuracy and precision of ILI data can considerably affect the PoF results. Calibrating the ILI data can potentially have an effect in determining the line PoF which is calculated for non-calibrated and calibrated ILI data. The PoF value for both the calibrated and non-calibrated ILI feature is calculated for the example (Table 3).
The leak limit state for the depth is the probability that the defect will reach critical depth (e.g. 0.75% NWT). The limit state of rupture threat feature is the probability that the feature reaches the critical RPR (e.g. 0.95). The PoF calculation in this example for rupture limit state is based on Modified B31G in order to utilize the calibrated maximum depth of corrosion features. Length is assumed to be the same for both calibrated and non-calibrated data. Calibration of ILI data can change the PoF of the line and the overall estimation of the health of the line (Table 3).

Apart from corrosion unity plot calibration, crack data can also be calibrated. The calibration used here is directly based on safety factor calibration. Safety factor is the ratio of fitness for service pressure over maximum operating pressure.
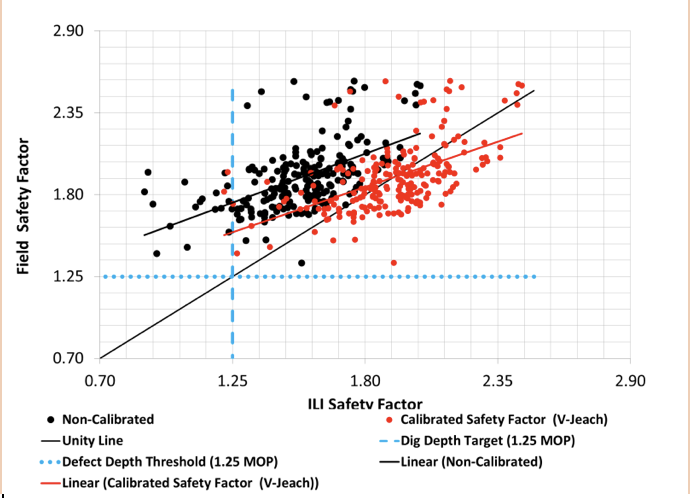
Figure 6 shows the over-calling calculated safety factor and all 18 features with safety factor below 1.25 MOP as reported by the ILI. In fact, it was demonstrated that the field safety factor of these features was higher than 1.25 MOP in all cases. The calibrated safety factor showed only three features had safety factor between 1.20 and 1.25.
The crack calibration not only can adjust the safety factor based on over-calling and under-calling of preliminary trending, but can also potentially impact the forecasted number of excavation digs. The forecasted number of the features can potentially impact the PoF value for the pipeline12. The PoF value was calculated for the case of a feature with safety factor less than 1.25 MOP to demonstrate the effect of calibration on crack PoF (Table 4)
Table 4: The effect of calibration on crack feature PoF.

Conclusions
Calibration of ILI data provides a potential opportunity to address ILI and NDE measurement errors. This should result in improving safety and reducing unnecessary resource expenditure on integrity-mitigation programs while ensuring the safety of the pipeline. If an ILI tool performance shows an under-calling trend for depth measurement, correcting this trend can improve the safety of the line by acting on additional integrity mitigations.
The proposed calibration approach is based on advanced statistical methods with their own limitations. A guideline on properly implementing the proposed approach is recommended to avoid statistical or data anomaly concerns; for example, sensitivity of calibration model due to the number of datasets from the unity plot, and measurement uncertainty for different morphologies and locations of features (i.e. close to the weld or in the main body).
Calibration of measurements has potential applications in pipeline threat management analysis programs including calibrating the depth of corrosion features, rupture pressure ratio (RPR), and safety factor of crack features. Consequently, the pipeline PoF and prospective integrity actions can be impacted.
Acknowledgements: This article is based on a presentation at the February 2016 Pipeline Pigging and Integrity Management Conference organized by Clarion Technical Conferences and Tiratsoo Technical in Houston.
Additionally, the authors wish to thank the co-op student, Matt Woo, who assisted in running several validation cases for this work as well as acknowledge Karmun Cheng’s peer review for this work. In addition, the authors wish to extend their appreciation to Vitaly Vorontsov who assisted in PoF calculations.
References
1Haines H., and Tomar M., Kiefner and Associates Inc., EC4-2 PRCI, ILI Tool Calibration Based on In-ditch Measurement with Related Uncertainty, Pipeline Research Council International Catalog PR-218-103608 R, 2013
2Caleyo F., Alfonso L., Espina-Hernandez, J. H., and Halle J. M., Criteria doe performance assessment and calibration of inline inspection of oil and gas pipelines, Meas. Sci. Technol. 18 (2007) 1787-1799
3Jaech J. L., Statistical Analysis of Measurement Errors, Jon Wiley & Sons, 1985
4Grubbs F.E., precision, accuracy and statistical comparison of measuring instruments Technometrics, Errors in measurement, 1973
5Fuller W., Measurement Error Models, Wiley, 1987
6Inline Inspection System Qualification, API Standard 1163, 2nd Edition, April 2013, American Petroleum Institute
7Li. YP., Fredine G., Hubert Y., Hassanien S., J. Woo, Making integrity decision using metal loss ILI validation process, International Pipeline Conference & Exposition 2016, Calgary, Canada, IPC 2016-64601.
8McNealy R., McCann R., and Gao M., Inline Inspection Performance Verification, NACE 07132, 2007
9Abdolrazaghi M., Hassanien S., Vorontsov V., Woo J., and Woo M., Corrosion Growth Rate management Plan considering measurement error, NACE Northern Area Eastern Conference, Oct. 18-21, 2015, Ottawa, Ontario, Canada.
10Abdolrazaghi M., Hubert Y., Hassanien S.,Statistical Relevance of ILI and Field Trending, International Pipeline Conference & Exposition 2016, Calgary, Canada, IPC2016-64127.
11Abdolrazaghi M., Hassanien S.,Cheng K., Relative Statistical Calibration of ILI Measurements, International Pipeline Conference & Exposition 2016, Calgary, Canada, IPC2016-64126.
12Cheng K., Abdolrazaghi M. Hassanien S., Effect of Calibration of Measurements on Integrity Reliability Analysis, International Pipeline Conference & Exposition 2016, Calgary, Canada, IPC2016-64430.
Disclaimer
Any information or data pertaining to Enbridge Employee Services Canada Inc., or its affiliates, contained in this article was provided to the authors with the express permission of Enbridge Employee Services Canada Inc., or its affiliates. However, this paper is the work and opinion of the authors and is not to be interpreted as Enbridge Employee Services Canada Inc., or its affiliates’, position or procedure regarding matters referred to in this paper. Enbridge Employee Services Canada Inc. and its affiliates and their respective employees, officers, director and agents shall not be liable for any claims for loss, damage or costs, of any kind whatsoever, arising from the errors, inaccuracies or incompleteness of the information and data contained in this paper or for any loss, damage or costs that may arise from the use or interpretation of this paper.

Comments