
April 2017, Vol. 244, No. 4
Features
Capacity Center’s Annual Top 20 Pipeline Traders
In 2016, Tenaska once again topped Capacity Center’s annual top trader listings, acquiring 4.786 Bcf/d of annualized capacity during 2016. BP came in second with 4.529 Bcf/d, with Direct Energy (3.611 Bcf/d), Sequent (3.241 Bcf/d) and Constellation (2.995 Bcf/d) rounding out the Top 5, respectively.
“We are also seeing an emerging trend toward more longer term, forward-dated deals that are being done many months prior to the traded capacity being ‘effective’ for example, deals done in April to start the following November, as well as in the fall to start the following summer,” explained Greg Lander, president of Skipping Stone, a global energy markets consulting and technology services firm, in announcing affiliate Capacity Center’s 9th annual Top 20 Capacity Traders Report
For the full year, Capacity Center said 47,398 trades took place between non-affiliated entities, excluding trades to effectuate merger and acquisition (M&A) transactions. There were 523 distinct trading partner company groups trading more than 50.3 Bcf/d of annualized transportation capacity on 72 pipelines.
The biggest upward movers in the Top 20 were United Energy Trading, moving up 38 slots from 50th place in 2015 to 12th in 2016 and Repsol, moving up 10 slots from 26th place to 15th. The sharpest declines in trading volume came from BNP Paribas, which fell 64 slots to 84th and NJR Marketing, which fell 12 slots to 22nd.
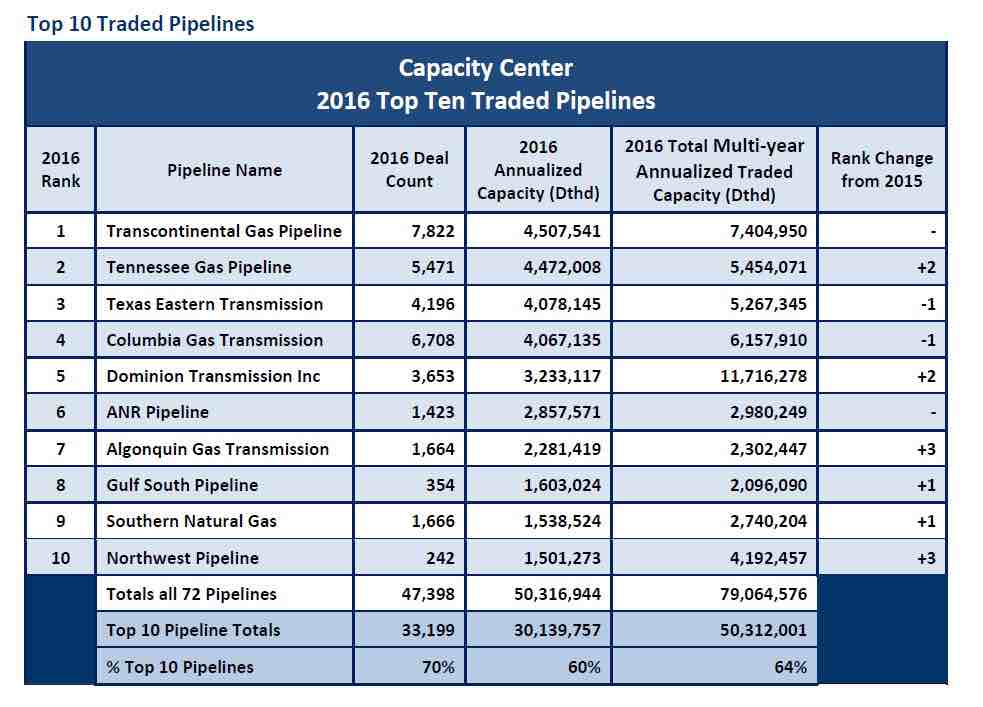
The Top 10 traded pipelines saw over 30 Bcf/d of annualized capacity traded in 2016 (67% of the total). These companies also accounted for over 33,000 separate trades, or 70% of the total number of trades. Leading the pack for annualized traded capacity for the year was Transco – the perennial leader in terms of traded capacity – at 4.5 Bcf/d, followed by Tennessee at 4.4 Bcf/d, Texas Eastern at 4.07 Bcf/d, Columbia Gas at 4.06 Bcf/d and Dominion at 33.3 Bcf/d.
Within the Top 10 traded pipelines there was some jockeying of position in total annualized traded capacity compared to 2015, but the most notable change was in how tightly bunched the four leading companies were in 2015 compared to 2016. Also of note, the Top 10 traded pipelines accounted for 60% of all the capacity traded.
Forward Capacity Trading
For the 2016 Capacity Trading Report, Skipping Stone also analyzed the trend toward forward market trading in capacity. To do so the research looked at two forward market time frames:
- The number, duration and quantity of deals entered into 60 days or more before the capacity became effective.
- The number, duration and quantity of deals entered into between 30 and 59 days before the capacity became effective.
In Case 1, there were 88 trading companies doing forward market capacity trades that became effective 60 days or more from trade date to effective date. The average number of days across that group for forward trading Case 1 was 222 days in advance of the capacity becoming effective.
Among the Top 10 forward market capacity traders, the average forward trade date of Case 1 deals was 269 days in advance of the future effective date. More notable was the comparison of volumes between Case 1 and Case 2. The annualized Dth/d of capacity for deals starting 60 days or more into the future was (3.63 Bcf/d) compared to deals effective between 30 and 59 days in advance of effective date, (1.93 Bcf/d).
“Combined, the results show that 5.56 Bcf/d, or just over 10% of all capacity traded in 2016, are deals done more than 30 days prior to release dates,” Lander said. “We can conclude from this that top traders are more actively seeking out release deals prior to their hitting the spot capacity market.”
The analysis showed that while 90% of capacity is traded in the spot market from one to 29 days in advance of the effective date of the traded capacity, the 10% of the market doing forward capacity deals – starting before the prompt month – will bear watching to see if that continues to grow or starts to shrink. Either way, the company said, it monitors to see if the forward market is affected by the coming basis erosion in certain regions.
“In short, we will see if more parties try to go long, or instead, endeavor to get ever more short by waiting until the last moment to lock in capacity and prices in the spot, or prompt, market,” Lander said.
Analysts looked at all pipeline capacity release transportation transactions on every pipeline in compiling the listing. To be counted toward the listing, a trade had to occur in 2016; multi-year deals had only their first year of capacity rights counted, to give an apples-to-apples comparison.

Comments