
March 2015, Vol. 242, No. 3
Features
Tackling Valve Misalignment Problems
Valve misalignments are a real issue in the petrochemical industry where misalignments in tank fields and blending areas can result in financial losses from product quality and environmental safety issues. This article describes an electronic pin board software solution developed by Matrix Technologies, Inc., a certified member of the Control System Integrators Association (CSIA), to mitigate valve misalignments and improve efficiency in the alignment process. It also details some of the underlying technologies used in the software and the gains that have resulted from its use.
Project Background
Integrated systems have been a control standard in the petroleum industry for quite some time. In blending operations, however, it is still common to use manually operated valves. At a client’s refinery site, the status of valves being open or closed was noted with paper drawings, charts, redlines and pin boards. These solutions may work for a handful of instruments, but were cumbersome and error-prone for handling 85 tanks and over 2,000 valves in the subject refinery’s tank field area.
Fifteen incidents of valve misalignments resulted in over $900,000 in documented financial losses throughout 2013. This financial loss was due to product-quality issues when tanks or deliveries became contaminated, and operational issues in which incorrect tank alignments caused process unit upsets. These incidents also presented a significant safety and environmental risk.
Eliminating these misalignment incidents required a change in procedure and a new integrated solution was needed to facilitate the changes.
Brainstorming A Solution
Understanding how the tank field operators monitored and tracked valve statuses was key to coming up with a solution that was usable and effective. The operators had an enormously detailed sitewide CAD drawing, printed and spread out over multiple ANSI D-sized sheets. They needed to see the entire tank field, but also needed to see the intricate valve configurations that connected the tanks (Figure 1). It was apparent the solution would need to make it easy to switch between a high-level overall layout of the tank field and an in-depth close-up of the valve lineups.
Discussions led to the decision to create a system that would monitor the configuration of every valve and tank on the site. Operators would communicate via radio the location of the valves that needed to be opened or closed, and workers in the field would radio back once the work was complete. Data, including if a valve was car sealed, or if workers had a difficult time operating the valve, would be entered into and stored in the system.
In order to get the level of detail required to show thousands of valves and quickly switch between different viewpoints, we had to move beyond standard HMI development tools. This led to the development of our own tools, using AutoCAD as the Graphical User Interface (GUI) for the system. The data management was handled by a Microsoft SQL Server database.
How Technology Works
AutoCAD is a tried and true tool in the engineering industry. The basic controls of interacting with a drawing are easy to learn. Autodesk offers software developers the functionality to integrate custom applications with AutoCAD to extend its features.
The software application adds new toolbars, command line options, and functions to AutoCAD’s existing set of commands. Operators can search for a particular valve based on its tag name or identifying information. Upon selecting a valve, the operator can change the valve’s status between “Open” and “Closed.” The change is visually relayed to the operator – a red valve indicates that it is closed, and a green valve indicates that it is open.
As the valves are configured between opened or closed, the changes are logged into the database. A client-server relationship between the AutoCAD HMI and the database server enables the use of multiple HMI clients running the customized AutoCAD software. The database catalogs input from the different HMIs and distributes the changes among all clients. Every HMI sees the same valve configuration.
The system as it is built runs on an isolated private network not connected to enterprise or process control networks. The database, however, has been configured for feedback and control uses. The software structure is in place to integrate and show live data from the field or to transmit control signals to the equipment.
System Security
As part of developing the AutoCAD HMI tools, one issue that had to be addressed was making sure the CAD drawing showed the tank field, valves and piping segments intact. AutoCAD is by design a tool for creation and editing, but the client needed the drawing content to be static.
In order to secure the state of the CAD objects and entities in the drawing, we implemented a security model based around user access. Different levels of users have different levels of access that were implemented in the software by disabling subsets of AutoCAD’s editing commands and functions.
Personnel were broken down into three user groups:
• Non-operational users, who could view but not make changes to the system.
• Operators, who could configure valves and enter metadata.
• Process engineers, who could make CAD-changes to the system.
Login credentials were created and provided so that the right individuals had only the access that they needed.
Operator Interaction
By designing a system built around PC software, we gained flexibility in the visual display hardware that could be used. Touchscreen monitors were one possibility, so as part of the GUI design, the AutoCAD Ribbon Toolbar was used to create large buttons that a finger could easily tap upon.
It was decided that the main display for the system would be as large as feasible, so that its contents were seen easily by all operators, even at a distance from display. This was achieved using an LCD television with a screen over 7 feet in diagonal, although a projector was also considered. AutoCAD’s native zooming capabilities complemented the size of the screen well.
When searching for a particular valve or tank, the system zooms out to show the entire site, and then zooms back in toward the object in question, helping convey relative geographic location. Zooming and panning are also tied to a computer mouse scroll wheel, giving operators manual, granular control over what they are seeing. These methods of interaction proved to be intuitive. Large areas of the site could be viewed on the television screen with moderate detail of the tanks and valves, and the detailed valve configuration could be reached at a moment’s notice without lag or loading time.
Innovation At Work
Once we had established the HMI interface, and the tracking of configurations and metadata about all of the tanks and valves, we took the steps to make the information usable. Knowing the configuration of the valves, we added in the data about how the piping itself was built and connected. This meant we could determine at any given moment which process materials were flowing through which pipes.
By adding in the piping configuration data – over 15,000 piping segments and how they joined together – we could display to the operators what would be the result of intended valve alignments.
The operators now catch the valve misalignments before they happen.
TANK-1635 (Figure 6) has been selected to identify the process flow path. It takes just a few seconds for the SQL server database to analyze all possible routes throughout the entire site, passing through open valves and stopping at the closed valves. The results are then displayed to the operator’s screen. In the case of this potential valve lineup, process is flowing between TANK-1635 and TANK-1625, perhaps unintentionally.
By identifying where process materials will be flowing, it is possible to see when tanks are cut-together – and determine whether they should be. Valve lineups can be checked throughout the entire tank field prior to being set on the physical equipment.
End Results
Currently, the AutoCAD HMI system has been running for over a year. The results are significant: The client reports a 100% decline in financial losses caused by misalignments, down from over $900,000 per year to $0.
In addition, by recording the valve changes within a database, reports and analytics produce data to determine which valves have been reconfigured multiple instances over a short period of time, and therefore may be prone to failure. These reports allow engineering to allocate funds to buy spare and replacement components ahead of time, reducing downtime and the urgency of getting a much-needed part at the last minute.
Finally, apart from the financial savings, one of the most notable successes may be the change in procedural workflow for the operators and engineers. The simplicity and ease in migrating over to the new system has led to it becoming a tool that they actively want to use.
Author: Eric Lauber is an electrical and computer science engineer with Matrix Technologies, Inc., where he works on industrial systems integration, application development, network design and process workflow improvement. Matrix Technologies is a certified member of the Control System Integrators Association (CSIA),
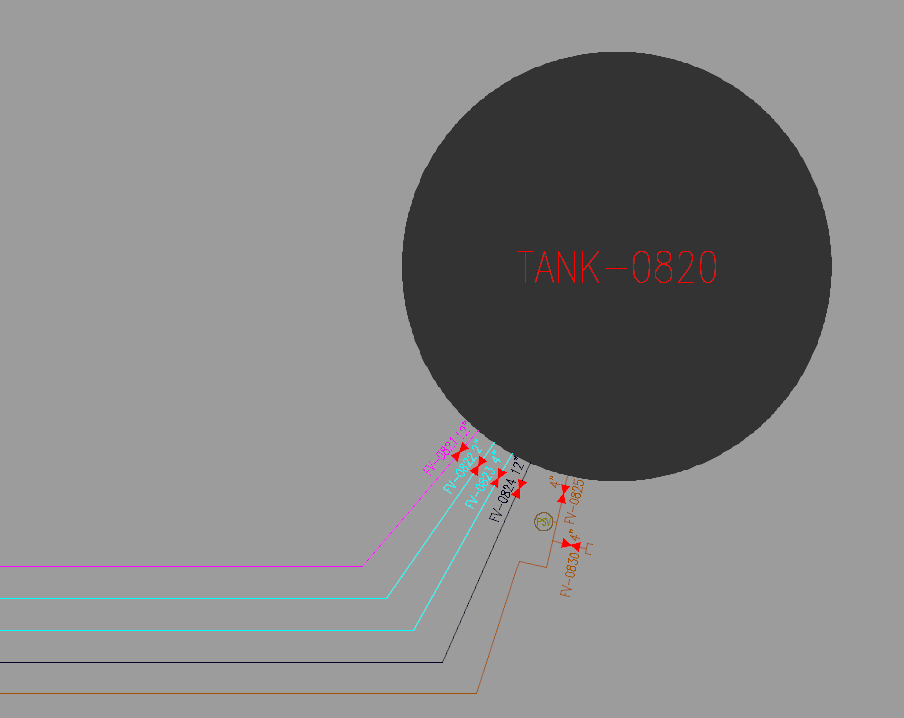
Figure 2: Valves configured as open (green) or closed (red) connect process piping. Layer colors (blue, pink, amber and black) indicate different process materials.

Figure 3: System architecture for AutoCAD HMI tools communicating with SQL server.
Figure 4: Connecting the AutoCAD HMI system to process network devices.![]()
Figure 5: Custom buttons and tools were added to the AutoCAD ribbon toolbar.
Figure 6: The current process flow path, depicted as lines and tanks colored green.

Comments