
June 2015, Vol. 242, No. 6
Features
Presidents Report Finds Energy Infrastructure Needs Major Investments
The need for major changes to the nation’s energy infrastructure is why President Obama initiated a quadrennial cycle of energy reviews to provide a multiyear roadmap for U.S. energy policy. The result is the recent release of the initial installment of the first-ever Quadrennial Energy Review 2015 (QER) prepared by the White House task force.
A central theme of the document is a need to modernize the nation’s energy infrastructure to promote economic competitiveness, energy security and environmental responsibility. The primary focus is on energy transmission, storage and distribution (TS&D), and the network of pipelines, wires, storage, waterways, railroads and other facility that form the backbone of the nation’s energy system.
The QER attempts to identify vulnerabilities in the system and proposes major policy recommendation and investments to replace, expand and modernize infrastructure where appropriate.
At nearly 350 pages, the document is too lengthy to cover in depth here. Instead, this article will primarily focus on the TS&D discussions and highlights from select chapters and recommendations.
A follow-up article will focus on pipeline and storage vulnerabilities and methane emissions.
Commenting on the QER, Energy Secretary Ernest Moniz, said, “The United States’ energy system is going through dramatic changes. This places a high premium on investing wisely in the energy infrastructure we need to move energy supplies to energy consumers.”
Don Santa, president and CEO of the Interstate Natural Gas Association of America, said, “INGAA appreciates the administration’s focus within the QER on the critical role of pipelines. This first volume recommends greater coordination across agencies, cost recovery and greater resources for key federal agencies involved in the siting, permitting and review of infrastructure projects, including pipelines.”
A statement by the American Natural Gas Association (ANGA) said, “With release of the QER, the Obama administration reaffirmed the role natural gas will play in ensuring energy security, economic growth and environmental improvement. An expanded and modernized energy infrastructure is critical to realizing those benefits.”
Energy Infrastructure
The United States has one of the most advanced energy systems in the world, including about 2.6 million miles of interstate and intrastate pipelines, 414 natural gas storage facilities, 330 ports handling crude petroleum and refined petroleum products, and more than 140,000 miles of railways that handle crude petroleum, refined petroleum products, LNG and coal.
The electrical component of the nation’s TS&D infrastructure links over 19,000 individual generators with a capacity of a megawatt or more (sited at over 7,000 operational power plants), with over 642,000 miles of high-voltage transmission line and 6.3 million miles of distribution lines.
Concerning the annual investments in oil and gas TS&D infrastructure, the report noted a 60% increase during 2010-2013 from $56.3 billion to $89.6 billion as the industry responded to the new energy landscape of rising North American production and declining imports.
By 2025, the industry is expected to invest $890 billion in new infrastructure, with over half directed toward crude oil and natural gas gathering systems and direct production support facilities.
Nevertheless, the QER finds much more is needed. One compelling example is the infrastructure for moving natural gas. Close to 50% of the nation’s gas transmission and gathering pipelines were constructed in the 1950s and 1960s – a build-out of the interstate pipeline network in response to the thriving post-World War II economy (Figure 1-1). Analyses suggest natural gas interstate pipeline investment will range between $2.6-3.5 billion per year from 2015-2030, depending on demand. The cost of replacing cast iron and bare steel pipes in gas distribution systems is estimated at $270 billion.
Production of oil and natural gas is occurring in new locations often removed from areas of historical production. As a consequence, the flow of both raw energy commodities and refined products is changing, placing demands on the infrastructure that moves them to intermediate users and consumers.
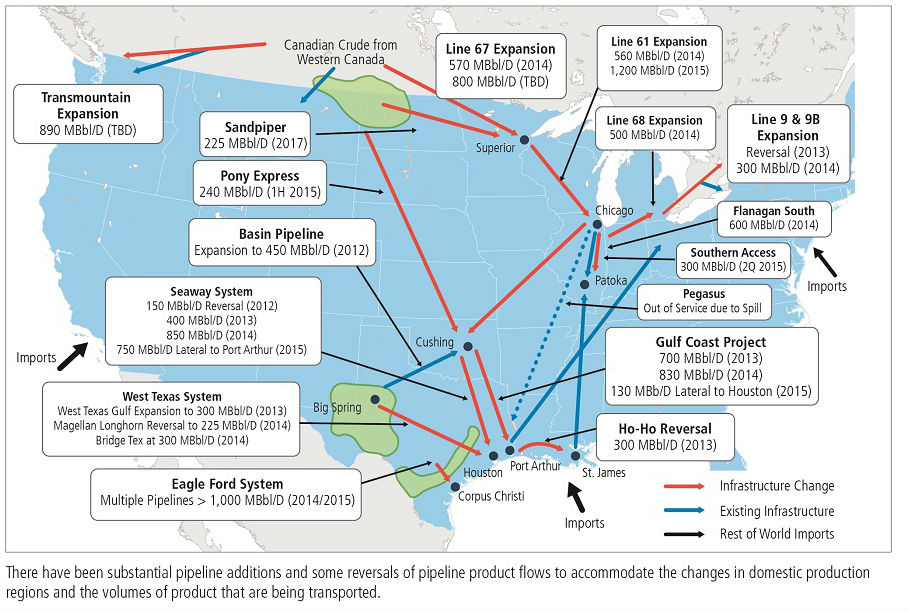
Historically, crude oil and oil products in the United States have tended to flow from south to north, to inland refineries. This generally has been reversed, with oil from the Bakken field in North Dakota and Montana moving from the north toward the Gulf of Mexico, as well as to East and West Coast refineries. Significant new quantities of crude oil from the Eagle Ford and Permian shale basins also are moving to Gulf Coast refineries.
To accommodate these changes in the volume and geography of U.S. crude oil production, there have already been substantial pipeline additions and some reversals (Figure 4-2). There have also been significant increases in barge, rail and truck transport of crude oil, crude oil products, petrochemicals and ethanol. This build-out of infrastructure has improved U.S. energy security. Without it, the nation could not have reduced its reliance on imports of liquid fuels to the extent that it has.
4,400% Increase in Rail Transport
Among the shared freight transport infrastructure, the rail network may have experienced the most significant changes in recent years. In 2009, roughly 10,800 carloads of crude oil originated on U.S. Class I railroads. By 2014, the volume of rail shipments had grown to more than 493,000 originated carloads of crude oil – an increase of roughly 4,400% in five years. The Energy Information Administration (EIA) estimates that over 1.02 MMbpd of domestic and Canadian crude were moved by rail in the U.S. in 2014.
Rail shipment of oil has increased in most U.S. production areas, but it has been of particular importance for the Bakken formation in North Dakota. As of mid-2014, rail accounted for over 60% of total oil shipments from the Bakken and 100% of Bakken-to-West-Coast deliveries (from North Dakota to Washington state and then by barge to California). As a result, the number of crude oil loading, unloading, and barge transfer points in the U.S. and Canada has grown markedly in the past few years (Figure 5-2). In 2010, there were only six rail-loading facilities for oil, and no barge-loading facilities. Three years later, in 2013, there were over 60 rail-loading facilities and a host of new barge-loading sites.
Federal Permitting Progress
Touching on the progress of federal review of significant midstream infrastructure, the QER said since 2009, the Department of Interior’s Bureau of Land Management (BLM) has authorized over nine major pipeline projects for oil, natural gas and water, with nearly 1,050 miles on BLM lands. The Federal Energy Regulatory Commission (FERC) has authorized about 4,500 miles of pipeline since 2009 and about 6,200 miles of pipeline have been put in service.
At the same time, the Department of Agriculture’s Forest Service approved and reauthorized on National Forest System lands 2,160 natural gas and oil pipelines covering 12,907 miles.
Despite these efforts, which have resulted in an estimated time savings ranging from several months to several years for particularly large and complex infrastructure projects, the diverse and often divergent sets of agency permit and decision-making responsibilities can cause friction and create inefficiencies, as well as extend the time frame for the federal permitting and review process.
QER recommends the allocation of resources to key federal agencies involved in the siting, permitting, and review of infrastructure projects and the adoption of the administration’s proposals to authorize recovery costs for the review of project applications.
Waterborne Energy Transport
Similar to the trends in rail transport, new domestic energy production is spurring rapid growth in the waterborne transport of energy commodities and related products. U.S. ports and inland waterways transported nearly 7 billion bbls of crude and petroleum products in 2012. Of that, 2.5 billion bbls were transported on barges on the inland waterways from port to port along the coast or on the Great Lakes – or in intra-port transfers.
In the near future, additional drivers of waterborne transport of energy commodities will likely include LNG exports. Moreover, some estimates show over $125 billion in planned petrochemical plant investments, most of which will occur along the Gulf Coast and other U.S. waterways.
Electrical Grid Challenges
Noting that electricity is central to the well-being of the nation, recommendations in the QER call for providing state financial assistance to promote and integrate TS&D infrastructure investment plans for electricity reliability, affordability, efficiency, lower carbon generation and environmental protection. The estimated cost is $300-350 million over five years.
In particular, the document said the DOE made a comprehensive grid modernization proposal in the president’s 2016 fiscal budget request. The cross-cutting proposal is designed to provide tools for evolution to the grid. The estimated cost is $3.5 billion over 10 years.
Climate Change
Since a major portion of the QER focuses on climate change, it seems worth noting that the administration’s actions under the “Climate Action Plan” put the country on a path to meet it’s 2020 and 2025 targets through several means, including establishment of carbon emission standards for the power sector that will drive further shifts to low- and zero-carbon fuels, calling for cleaner electricity generation technologies and continued improvements in end-use efficiency. Historic and projected U.S. emissions under these latest targets are shown in Figure SPM-2.
According to the report, the effects of global climate change have stressed energy TS&D infrastructure in several ways. Extreme weather events with high societal costs have been increasing, a trend the report expects to intensify with continuing climate change.
Employment, Workforce Training
The report said about 1 million people were employed in energy transmission and distribution jobs in 2013, representing almost 0.75% of U.S. civilian jobs. An additional 900,000 jobs were indirectly supported by energy transmission and distribution activity.
Projections indicate by 2030 the energy sector, including the TS&D segment, will employ an additional 1.5 million workers. Most will be in construction, installation and maintenance, and transportation, and about 200,000 more workers with computer and mathematics skills will be in demand.
Changes in the electricity sector, in particular, are expected to affect the number and types of energy jobs as new technologies change skill set demands. This, the report finds, will create opportunities that include utility management positions for smart grid programs, meter installers and service providers, intelligent transmission and distribution automation device producers, communications system products and services providers, and software system providers.
Accelerating methane abatement actions in the natural gas TS&D system is projected to support a significant number of jobs. One study projects an accelerated replacement timeline along with other measures could support 313,000 jobs throughout the economy.
The report warns that new job-driven training strategies, reflecting a broader range of needed skills, will be required to meet workforce challenges of the future.
North American Findings
Noting that the U.S. has significant energy trade with Canada and Mexico, including oil and refined products, gas, and electricity, the report calls for greater coordination with the two countries. Canada is the largest energy trading partner of the United States with energy trade valued at $140 billion in 2013, while Mexican energy trade was valued at $65 billion in 2012. Both countries are considered reliable sources of secure energy supplies.
For this reason, the QER recommends greater coordination to improve energy system efficiency and build resiliency to disruptions of the North American energy market, data exchanges and regulatory harmonization.
The report also calls attention to an opportunity to lower Caribbean electricity costs and emissions. Since the Caribbean is largely reliant on foreign sources of oil with little energy resources of its own, energy demand is driven largely by electricity generation, mostly from fuel oil. The QER projects a 30% decrease in carbon dioxide emissions by displacement of fuel oil by natural gas for electricity generation – even more if combined with renewable energy.
Oil and Gas Production, Proved Reserves
Noting the U.S. is the world’s largest combined producers of petroleum and natural gas, the QER points out that oil production rose 35% from 2011 to 2013. Proved reserves of crude oil and lease condensates increased each year from 2009 through 2013 and total more than 36 billion bbls – a level not seen for almost four decades.
Some of this increased production has been in locations lacking pipeline capacity. Proved reserves of crude oil and lease condensate in North Dakota surpassed those of the federal waters in the Gulf of Mexico, ranking North Dakota second to Texas among oil-producing states.
It also shows the profile for U.S. natural gas production and reserves is similar. Between 2005 and 2013 production rose by 28%, and in 2013, proved natural gas reserves hit a record 354 Tcf. In 2013, shale gas accounted for 38% of U.S. production and 47% of proved gas reserves; between 2010-2013 shale gas production rose by 114%.
There is a dramatic change in the geography of gas production and reserve. A 70% net increase in proved gas reserves occurred in Pennsylvania and West Virginia. This production is also occurring in locations where natural gas has not been produced in the past, changing movement of product flows and placing demands on the infrastructure to move product to consumers.
Less Oil Consumption
As oil and gas production are growing, while oil consumption, and particularly consumption of a major refined product – gasoline – has been falling. Several factors are credited, not least of which is the historic fuel economy standards set by the Obama administration for light and heavy vehicles.
The EIA forecasts show a slight drop in oil demand by 2040 as a result of these standards; this is a significant change from previous forecasts, which anticipated increases in fuel demand in 2040.
Oil Imports
As a consequence of increased oil production and decreased oil consumption, net petroleum imports have declined, reducing dependence on foreign oil to levels not seen in more than 40 years. In 2005, net imports of crude oil and petroleum products averaged about 12.5 MMbpd of a total of 20.8 MMbpd of product supplied. By year-end 2014, net imports of crude oil and petroleum products exceeded 5 MMbpd of a total of 19.6 MMbpd.
The United States remains a large crude oil importer and petroleum product exporter. This links into the global market tie the nation has to global oil prices and oil price volatility. The report said continued attention to infrastructure, and the Strategic Petroleum Reserve, that address those vulnerabilities will require $1.5-2 billion to increase the incremental distribution capacity of the SPR.
Petroleum Products, Natural Gas Exports
Overall, the QER points out the export of crude oil and petroleum products have increased dramatically. In 2005, the U.S. exported 1.2 MMbpd of crude oil and petroleum products (gasoline, distillate, jet fuel, petroleum coke and hydrocarbon gas liquids), By October 2014, this grew to 4 MMbpd of crude oil and petroleum products. Almost 92% of total exports are refined products from oil, while only 8% is crude oil. Many of these refined products are produced or shipped from the Gulf of Mexico.
The United States is positioned to become a major exporter of natural gas just 10 years after an accelerated development of significant import capacity. Rising supplies and falling natural gas costs opened a price gap with other parts of the world and eliminated most of the need to import LNG. In response, developers are repurposing previously constructed import terminals to allow exports.
Approved LNG export permits to Free Trade Agreement and non-Free Trade Agreement countries total about 40 Bcf/d and 5.74 Bcf/d, respectively. Total capacity of natural gas pipelines to Mexico was 6.5 Bcf/d in 2008; by 2016, EIA projects the nation will export over 1 Tcf of natural gas to Mexico annually.
According to the Congressional Budget Office, without shale gas U.S. natural gas prices would be 70% higher than projected prices by 2040. This has enabled some petrochemical facilities to gain an export advantage over other parts of the world. Many expansions and additions to the nation’s petrochemical manufacturing sector have been announced. The industrial sector as a whole has also taken advantage of abundant natural gas.
The report cites abundant natural gas supply and comparatively low prices for affecting the economics of electric power markets. Natural gas demand for power generation grew from 15.0 Bcf/d in 2005 to 21.4 Bcf/d in 2013, and is projected to rise by another 6.2 Bcf/d by 2030. Electricity generation from natural gas rose by 85% from 2000-2013, from 601 terawatt-hours in 2000 to 1,114 terawatt-hours in 2013.48 Total U.S. natural gas consumption in 2013 was 71.6 Bcf/d.
The report found that infrastructure changes may be needed to accommodate future growth in natural gas use for power. Those include repurposing and reversing existing pipelines, additional laterals to gas-fired generators and more looping and compression to the existing network. Other needs could include new pipelines, although, this could be regionalized, and additional processing plants and high-deliverability storage.
Under several scenarios, the pace of these changes for the interstate natural gas pipeline system through 2030 is projected to be comparable to or less than historical build rates.
Editor’s Note: For a copy of the QER, visit www.energy.gov.

Comments