
November 2014, Vol. 241, No. 11
Features
Stagnant 2013 Economy Shows Gas Consumption Up In North America And China But Nowhere Else
Natural gas consumption growth was down in 2013 everywhere but in North America, reflecting the major differential between North American natural gas prices and those in the rest of the world. Although the global economy remained lackluster, there was overall growth in energy consumption worldwide, with higher than average consumption growth in OECD countries and lagging averages in the developing world.
This information comes from BP’s statistical review of world energy, the 63rd annual report from the company on the global condition of energy supply, consumption and prices.
The report lists global growth in natural gas consumption at 1.4%, compared to a historical growth rate of 2.6%. The decline is notable in India, where gas consumption was 12.2% down as cheaper coal crowded out price-controlled gas. In Europe and Eurasia, where 31.7% of all gas is consumed, 1.4% less was used in 2013. Decreases from 2012 consumption levels in those two regions alone added up to over 25 Bcm.
In the United States, meanwhile, the large jump in natural gas consumption seen in 2012 held steady and even increased further, up 14.2 Bcm to 737.2 Bcm total, after a 29.9 Bcm jump 2011-2012. Canadian and Mexican consumption rates grew by about 3 Bcm each. North America accounted for nearly 28% of world natural gas consumption in 2013, the highest proportion following Europe.
The most significant increase in natural gas consumption came from China, which added 10.8% or 15.3 Bcm to its demand. That increase is lower than its 2011-2012 growth rate and considered weak by analysts, but combined with the growth in North American demand it equals nearly all the increase in consumption observed over 2013.
Low hydroelectricity output in Brazil led to that country using more oil and natural gas in 2013, but there is no expectation that this pattern will continue.
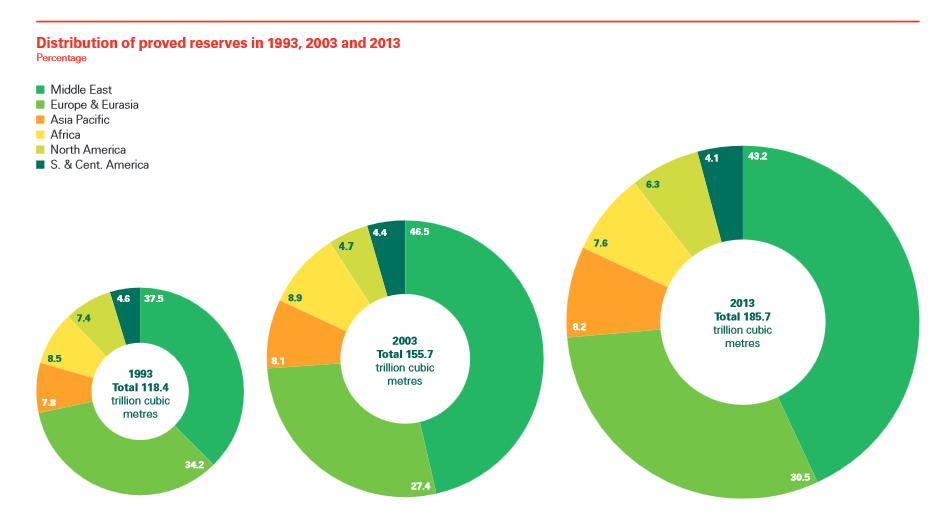
Proved reserves of natural gas continued to increase, but the problems of politics, geography, transportation and infrastructure combined to keep global prices high. A glance at a chart of world gas distribution demonstrates that the balance of natural gas resources worldwide did not change much between 1993 and 2013, despite the fanfare the North American unconventional gas boom has caused in the world market. This suggests that infrastructure and technological advantages in North America and the proximity to the consuming market are the features that have made increased volumes of natural gas more important in that region than in others.
This perspective adds interest to the data regarding pipeline transfers, which show the United States importing nearly twice as much natural gas via pipeline as any other country at 78.9 Bcm, and exporting a hefty 44.4 Bcm to its neighbors. The Russian Federation exports 211.3 Bcm and Norway 102.4 Bcm in more or less unilateral trade to Europe.
China, despite its growing needs, received significant pipeline gas in 2013 only from Turkmenistan (24.4 Bcm). It imports one-third of its natural gas and showed the second highest international increase in production in 2013, but is moving toward more pipeline imports and more natural gas use. The increases in natural gas use are “part of a deliberate policy to diversify the domestic fuel mix” in China, said Mark Finley, general manager for global energy markets and U.S. economics for BP.

Total international pipeline transfers worldwide added up to 710.6 Bcm, less than 24% of natural gas consumed. LNG movements totaled 325.3 Bcm, about 11% of natural gas consumed. These two figures underline the current role of market proximity in commercializing natural gas resources. Although Asia continued to receive 80% of LNG shipments, some delivered over very long distances, its consumption of LNG did not increase in 2013. How the many LNG facilities scheduled to come online affect that trend is yet to be seen, Finley said. While natural gas consumption may take the place of other energy sources, there are no guarantees.
In the United States consumption of natural gas for power generation declined more than it has in 40 years, with most of the slack picked up by plants returning to coal as a cold winter and lack of storage and pipeline capacity pushed gas prices up. However, there were no signs of a supply response, as most rigs were deployed in search of oil.
Oil prices remained at their highest ever and at an historically unusual stability, around $100 a barrel for three years. Record production growth in the United States matched losses in the Middle East and Libya. All net growth in oil consumption came from emerging economies, Finley said. However, declines in European consumption were wiped out by the United States posting the highest single-country demand growth figures against its trend of decreasing demand in recent years.
The contrast between the long-term and short-term prospects for newly abundant oil and natural gas in the United States is dramatic.
“For natural gas, [the United States is] an isolated regional marketplace. There’s nowhere for that growth in production to go except in chasing prices down to provide an incentive for domestic demand to grow along with it,” said Finley.
“With oil, on the other hand, the United States is still part of a global oil market. Even as U.S. production has been growing, we saw the data. Oil prices globally haven’t fallen,” so there’s no incentive for U.S. consumption to rise over the long term.
“In other words, the shale benefit for gas has been lower prices and improved domestic consumption. The shale benefit for oil has been a significant improvement in the balance of trade.”
The exception has been light condensates, such as propane, ethane and napthas for which U.S. export controls result in depressed pricing as refineries struggle to keep up with high domestic production. Businesses that could exploit the local discount were at an advantage, and these fuels showed very rapid consumption growth in the United States. In fact, Finley said, 80% of the growth in U.S. oil consumption came from the industrial sector.
“I certainly hear a lot of people say this U.S. energy boom is going to have profound implications for natural gas demand in the industrial sector, and there are a lot of people looking for the evidence of an industrial renaissance in natural gas demand.” In 2013, Finley said, that demand showed up not in natural gas, but in light oil.
Still the world’s dominant fuel source, oil has lost market share every year since 1973, Finley observed. In the past 20 years, though, non-fossil forms of power generation are also down, failing to keep up with rising demand. Nuclear and hydropower both saw small rises in 2013, and renewables now comprise 16% of the global power generation pie. Europe in particular has seen its carbon emissions drop to 1960s levels. But the largest producers and consumers of energy, China, the United States and Russia, have rising emissions and fossil-dependent economies. And as renewables provide a greater percentage of all energy, subsidies to support them will be harder to sustain, which may limit how much they can grow.
Economists expect economic activity to drive energy use, Finley said, not the other way around. But that might not always be a correct assumption. “You can see how those relationships might switch. For example, in the United States, it’s very easy to imagine how this renaissance in energy activity could have implications for the economy.”

Comments