
March 2014, Vol. 241 No. 3
Features
Leveraging Previous Inline Inspection Assessment Results
Pipeline integrity managers routinely receive inline inspection (ILI) tool data, in some cases, for the second or third pig run on a particular segment of pipe. Integrity managers largely spend time on the first ILIs in classifying anomalies under Part 195 and Part 192 criteria, excavating these anomalies and repairing the pipeline as necessary, based on the findings.
The results of these digs are then periodically reported to PHMSA for evaluation to measure the effectiveness of the pipeline integrity regulations in the United States.
Running smart tools, classifying anomalies per the 192.933 or 195.452 requirements, repairing anomalies and defaulting to the prescriptive reassessment interval appears to be the approach of many managers. While following this minimalist approach improves the way some integrity programs operated prior to the introduction of pipeline integrity regulations, it does not fully leverage the data pipeline companies are paying to gather while using smart tools on their pipelines.
There are additional ILI data management and analysis requirements from the Pipeline and Hazardous Material Safety Administration (PHMSA). These come in the form of hazardous liquid and gas transmission pipeline facility integrity inspection protocols and frequently asked questions (FAQs).
Both the protocols and the FAQs are available at the PHMSA website. Integrity Solutions has developed a work flow and supporting software application (“ILI anomaly management tool”) to support the required analysis as required in the pipeline integrity management code (49CFR192 Subpart O & 49CFR195.452), integrity inspection protocols and FAQs. This work process will provide the pipeline integrity manager with information needed to make better decisions on inspection locations, repair programs and reassessment intervals by comparing recent ILI results with previous ILI results.
Anomaly Management Process
Figure 1 contains a high-level work flow for managing the data generated from multiple ILI tool runs. The focus of this article is the comparison of current ILI data to previous ILI data and the description of potential levels of anomaly growth rates as calculated in Figure 1 with the support of the management tool software.

Pipeline integrity management regulations in 49 CFR 192 and 49 CFR 195 clearly list the criteria under which an anomaly must be classified (immediate, scheduled, 60-day, 180-day, monitored, etc.). Further, these code sections clearly state required response times for each classification and the determination of a discovery date.
As mentioned previously, PHMSA maintains additional compliance guidance in the form of inspection protocols and FAQs. These protocols and FAQs require a pipeline operator to consider previous assessments when developing mitigation plans. PHMSA guidance also contains a requirement to calculate or develop a corrosion rate that can be applied to known or unknown anomalies to support reassessment interval calculations. Specifically, the 192 IMP inspection protocol F.01 and F.04, ASME B31.8S – Appendix A1.5, API 1160, Section 10 discuss the requirement to include previous ILI assessment data in the response analysis.
Integrity Solutions has participated in several PHMSA integrity management audits. PHMSA auditors consistently request additional justification for the prescriptive reassessment interval. Based on the compliance information provided by PHMSA, it is evident that more analysis is required beyond classifying anomalies and making repairs based on those classifications.
Anomaly Management Software Tool
The anomaly management software tool uses the Pipeline Open Data Standard (PODS) data exchange format for storing ILI data. Managing ILI tool runs in a common location and format has been eases the overhead burden associated with performing analysis on the data, as well as reducing the labor associated with required ILI indication reporting. A central ILI database can also be queried and mined to extract useful integrity information supporting other integrity management processes.
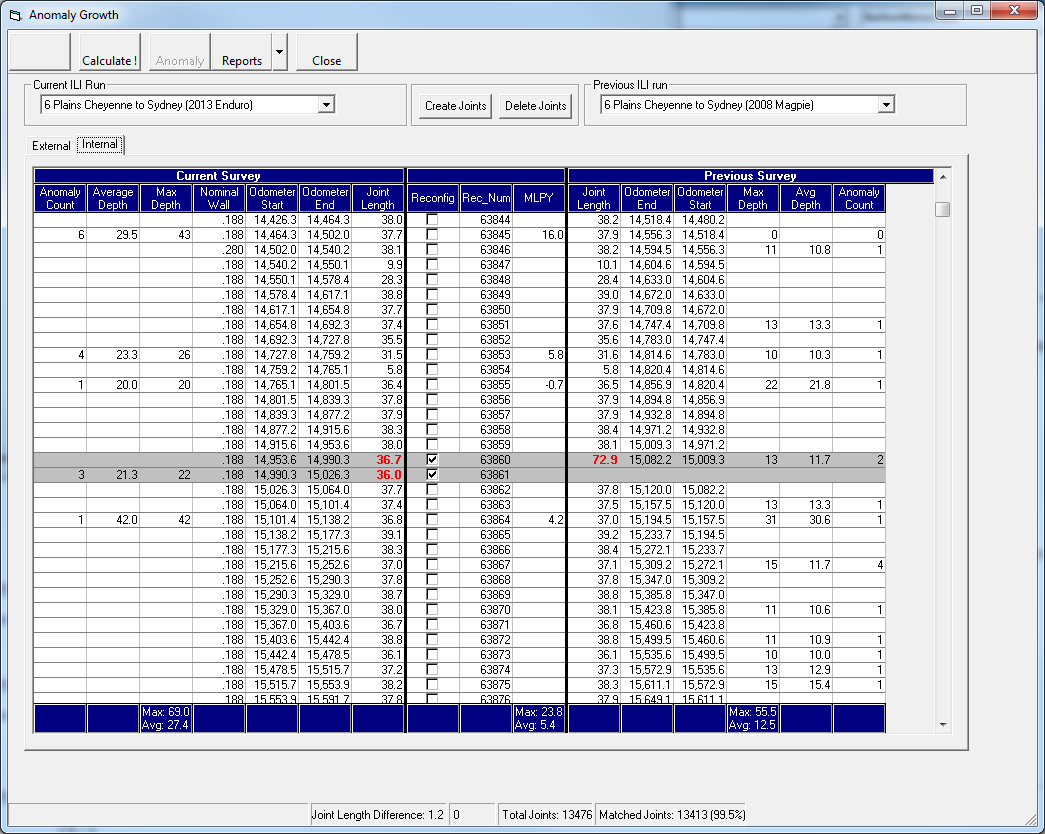
In order to initiate the process of calculating the growth rate between two ILI runs, there must be some type of matching performed between the two datasets to align all pipe sections. This process begins by matching joints of pipe between the two ILI datasets – using the reported girth welds and the associated distance between the welds. Experience shows a software-assisted matching of 90% or more of the joints is achievable. Matching the joints allows the analyst to correct for pipeline length error one joint at a time (i.e., place the error where it belongs vs. scaling the entire dataset with a single factor).
Upon completion of the joint-matching process, the inspection data is aggregated on a per-joint basis. This includes identification of the deepest internal and external anomaly on each matched joint. These aggregated depths are used in the wall loss rate and mills per year (MPY) calculation. Comparing the absolute reported depth on a joint-by-joint basis has many advantages:
• Comparing the joint-by-joint maximum anomaly depths allows the integrity manager a quick look at how the pipeline as a whole is behaving.
• The comparison of data aggregated at the joint level provides a screening tool to allow the integrity manager to quickly identify concentrated areas of concern along the pipeline.
• Emerging threats can be identified. The presence of metal loss or dents on a joint that had neither previously could signal an emerging threat.
As a result of performing the joint matching, the pipeline operator recognizes other benefits, too. Figure 2 contains an example of two joints of pipeline that did not match between datasets.

As a result a “matched pipe exceptions” report can be generated, which can be used to provide lists of locations needing further investigation and pipe that was installed after the last ILI run. The list also provides a quality check of the pipeline operator’s engineering data system of record.
Multi-Dataset Analysis/Calculations
To this point, all of the tasks performed have been in support of the necessary wall degradation rate calculations. These calculations result in MPY metal loss rate. This calculated rate can be used in support justification of the reassessment interval, to document operator effectiveness and provide rationale for asset management budgeting.
As supported by the anomaly management software tool, these MPY calculations can be performed at the pipeline, joint or girth joint, or anomaly level.
Anomaly growth calculations performed at the pipeline level are the most basic and compares average wall loss change across an entire pipeline for two ILI datasets. The resulting growth in external and internal metal loss is divided by the years between ILI runs to develop a result for MPY. This calculated pipeline MPY can be used to justify the reassessment interval for ILI. As an example, Figure 3 shows a pipeline-wide rate being applied to each anomaly in a dataset. The black anomalies are shown with respective rupture pressure ratios (RPR) and the purple anomalies are shown at the expected RPR after five years of 12 MPY growth.

The degradation rate established during the joint matching exercise can also be used to calculate an MPY for each joint. Figure 4 shows a histogram of calculated corrosion rates, MPY, for each joint on the pipeline. Evaluating the joint-MPY dataset in this manner allows for the evaluation of the entire asset for areas with extreme degradation rates.

The software tool applies this joint-by-joint corrosion rate to all anomalies in the dataset in order to calculate an expected RPR at the reassessment interval. From this analysis, it can determined which anomalies must be mitigated in order to justify a reassessment interval. Alternately, the integrity manager can review this data to determine if the more feasible path is to remediate fewer anomalies and instead shorten the reassessment interval.
The joint-by-joint analysis can act as a screening tool to find areas of the pipeline experiencing the largest corrosion rates. In these areas, it would be reasonable to match individual anomalies for purposes of MPY calculation.
Years To Critical Calculations
When MPY rates are used to calculate a “years to critical” (response time) for an anomaly, the value increases. This is the point at which the leverage of considering both historical and current ILI datasets becomes apparent.
The years-to-critical calculation in the anomaly management software tool is the lower of two criteria: years it takes an anomaly to grow to a depth of 80% of nominal wall thickness or to a depth and length that will produce a rupture failure pressure/maximum allowable operating pressure (RFP/MAOP) value = 1.1.
The analyst can apply the calculated degradation rate to each reported anomaly on the most recent ILI dataset. Using the selected degradation rate, the years to critical can be calculated for each anomaly. This metric can be used to support the integrity manager’s decision-making process.
There are additional datasets that can be developed based on the joint matching work tools when developing a pipeline asset management plan that includes pipes with new dents and new metal loss anomalies.
At-Risk Pipe Schedules
Integrity managers are often called on to assist in repair and replacement decisions. Having calculated a “response date for each and every joint and anomaly, this task is simplified. Figure 5 illustrate show many joints will need some type of response by year, going forward from the time of the most recent ILI dataset. That response can be a reassessment or a decision to dig in order to investigate the anomaly.

Figure 6 contains a listing of girth welds that have an anomaly within 1 foot of the weld. This type of graph is based on the “years to critical” of the anomaly within 1 foot of the girth weld. This helpful when dealing with a pipeline with large amounts of corrosion at the girth weld, possibly caused by uncoated girth welds or girth welds coated with incorrectly installed shrink sleeves.

There are other pipeline level analyses possible when comparing two ILI datasets. Even prior to joint or anomaly matching a metal loss severity chart, such as the one found can be created (Figure 7). This type of analysis can provide an immediate assertion as to the changes in the pipeline from the previous ILI.

It is possible none of the anomalies in the datasets used to create the graph in Figure 7 were “categorized” anomalies. This could result in the rather sudden increase in anomaly size not considered in the asset management decisions for the pipeline.
Once the growth analysis is completed, the anomaly management software can be used to support the creation of a remediation plan. The code requires that the ILI data be analyzed, along with all other available pipeline data. Creating integrity profiles (Figure 8) can help the integrity manager evaluate the ILI results.

These profiles allow the integrity manager to integrate location and proximity data from the ILI dataset. Anomaly clusters can be easily identified when graphically plotted. These can be clustered in terms of lineal stationing or in terms of “o’clock position” – either way can provide useful decision-making data.
Conclusion
Running smart tools, classifying anomalies under 192/195 requirements, and digging and repairing is not enough. PHMSA requires the use of prior assessment data in order to manage integrity threats to pipelines. This costly effort requires extraction of all the ILI data value that is available to a pipeline operator.
A rigorous and standardized comparison of multiple ILI datasets provides the pipeline operator with several useful outcomes:
• Compliance with all PHMSA requirements, including those beyond the CFR
• Increased vision into developing or new pipeline threats
• Implementation of additional repairs, replacements or prevention and mitigation (P&M) measures
• Documentation of ILI effectiveness as an integrity assessment method for corrosion and third-party threats
• Better information for asset management decision support
Asset management should always be based on the results of a cost/benefit analysis. The benefits associated with reducing risk, prolonging asset replacement, avoiding bad press coverage and responding to market opportunities are higher than ever. Successful integrity managers of the future will be those that fully leverage available “big data.”
Authors: Mark Madden has 24 years-plus of engineering experience, including 20 years in the oil and gas pipeline industry. He an expert on pipeline risk-modeling and DOT pipeline integrity management rules. Madden holds bachelor’s degree in civil engineering from the University of Colorado, Boulder.
Brian Yeagley has 20 years-plus experience in engineering, including 12 years in pipeline integrity management. He has been involved in the development and implementation of multiple integrity management software applications. Yeagley has a master’s degree in business from DePaul University, Chicago, and a bachelor’s degree in engineering and petroleum refining from Colorado School of Mines, Golden, CO.

Comments