
April 2014, Vol. 241 No. 4
Features
North American LNG Exports Effect On Global Gas
Natural gas industry commentators, bulls and bears alike, know and agree on one thing for certain – North America will export LNG. This is most likely to occur by 2016 from the Sabine Pass terminal.
Where opinions differ concerns how much LNG will be involved, where it will go, what price it will bring and what it will mean in the context of the wider gas market.
In the face of so much uncertainty, nobody can predict the future path of global gas markets with total confidence. However, in its proprietary World Gas Model, Nexant is able to offer its clients a powerful tool to analyze all the “what ifs?” that need to be answered. This article describes just one possible scenario based on our base-case assumptions.
Nexant base case projects that global natural gas consumption will continue to grow at an average annual rate of 1.9% until 2025, after which it slows to 1.1% due in part to increased energy efficiency, reduced energy intensity and environmental drives.
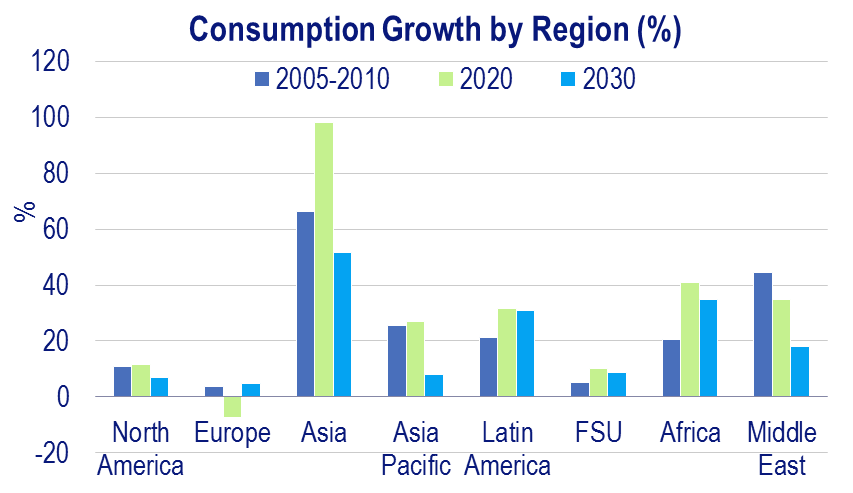
Demand is forecast to increase by 1,400 billion standard cubic meters (Bscm) from 2012 to reach around 4,900 Bscm by 2035 – slightly less than the International Energy Agency (IEA) projects in its new policies scenario. Much of the increase in demand is driven by power generation needs in Asia, especially China and India. In fact, the region is forecast to account for 500 Bscm or 48% of the growth out to 2035.
Demand growth in the Middle East is also driven by increasing power- generation needs and the growth of gas in industry – both as a feedstock and in industrial processes. The less mature African and Latin America market will also show some growth.
Growth in European consumption is positive going forward, although from a depressed base, but demand profiles vary with the larger mature countries such as the United Kingdom, Germany, France and Italy exhibiting little growth or even continuing declines.
In the long term, the effect of energy efficiency and reduction in energy intensity markedly slow growth. North America will continue to be the largest consuming region with demand stimulated from the rise in indigenous gas production and relatively low regional gas prices.
Where Will The Gas Come From?
More than half of current global gas production can be found in North America and the former Soviet Union (FSU). Both shale and coal-bed-methane (CBM) production will increase two-fold over the next two decades, but it is still conventional gas output that will make up the bulk of future production, coming at an increasingly higher cost, consistent with more difficult to extract offshore deep water deposits, CBM and shale developments outside of the United States.
Changing Pattern Of Wold Trade
Russia has dominated inter-regional pipeline exports for five decades and will continue to do so, although increasing exports will come from Caspian producers, Iran and Iraq to Europe and Asia. The most talked about development in trade is in the LNG market, with shale gas production transforming North America from net importer to net exporter.
The likes of Trinidad and Tobago, African and Middle Eastern exporters that once targeted North American LNG demand have had to find buyers elsewhere, looking to Asia and Europe. But Asia has been the winner, offering wider differentials than Europe for sellers to exploit. Had the United States not reduced its import needs in recent years, Europe would have faced a tighter market than was seen in 2012.
The addition of liquefaction capacity from North America, Papua New Guinea, Australia and Mozambique, among others, will change the supply mix, giving buyers more choice. Capacity should increase by 80% over the next two decades from just over 300 Bscm in 2012. The majority of additions are from North America and Australia, although with many Australian projects there is relatively higher uncertainty attached due to cost increases and growing regulatory obstacles.
Utilization of the liquefaction capacity, now at 96%, signifying market tightness, is expected to fall as more capacity comes online, softening the market, as competition increases.
Of the 34 proposed North American LNG export projects Nexant believes seven projects could be online by 2020. These provide a potential total of about 112 Bscm/y (or 82 Mtpa) of capacity.
Cheniere’s Sabine Pass liquefaction terminal in Louisiana, after having received both FERC and DOE approval to export to non-Free Trade countries, will be the first LNG export project to come online in 2016. Freeport, Lake Charles, Cove Point and, just recently, Cameron have also been given non-FTA approval, but given that these projects have not taken final investment decision yet or been given FERC approval, the earliest start date for these projects would not be before 2018.
The likelihood of a project proceeding depends in part on how much capacity, if any, is contracted, as this provides clarity on how investments can be recouped. Of the 112 Bscm of capacity considered, contracts are in place for about 90 Bscm by 2020. Most of this is held in portfolio contracts, giving flexibility in destination.
For example, Sabine Pass has 16 Bscm of its capacity in portfolio contracts, with the remaining capacity contracted out to the United Kingdom, India and Korea. Lake Charles has contracted out more than half of its capacity to BG Group in a portfolio contract while the rest of the projects have a focus on Japan, India and Korea.
Exports out of North America are projected to exceed 87 Bscm by 2021. The destination of the balance of exports will be determined by competition with other exporters which can be analyzed using Nexant’s World Gas Model. Results are sensitive to the assumptions made. In our base case using the assumptions outlined above, through contracts already in place, we know about 30 Bscm of capacity from the listed projects is contracted out to Japan, Korea and India .
Japan and Korea take most of the U.S. LNG. The largest market is Japan, importing up to 47 Bscm from North America in 2035. India takes a steady but modest amount of LNG, but the residual destination for U.S. LNG exports indicated by the model is Europe. Cargoes are taken by the United Kingdom and the Netherlands quite consistently, as well as France, Belgium and others. Latin America will also import from the United States, before production in that region ramps up and displaces U.S. LNG.
Penetration of the Japanese market by U.S. LNG comes at the expenses of West African gas, as well as some volumes from the Middle East. Most of the decline in imports from the Middle East can be explained by the expiration of current contracts. There is uncertainty on how many contracts will be renewed. What is clear is that those wishing to retain position in the Japanese market will need to do so on terms that compete with U.S. exports.
At the end of January, for instance, Japan’s Tohoku Gas reportedly signed a 15-year contract with Qatar for 60-90 tons LNG starting in 2016, doubling by 2018, so Japan’s U.S. LNG takings could shift as more contracts are signed. Much of the displaced Middle East LNG is diverted to China.
The effect of this surplus gas post-2016 can be seen in the divergence in projected spot and contract prices. Until 2016, NBP and Japanese spot prices approach their competing oil-linked prices before dipping as 2016 nears. As demand catches up with supply post-2030, spot prices start to rise again, particularly noticeable in Japan, which has an increasing volume of contracted LNG.
What is more striking graphically is the differential pricing movements between North America and the European and Far East markets. Henry Hub is set to remain the lowest price through to 2035, keeping close to the cost of supply. And unlike the rest of the world where prices are falling post-2016, Henry Hub is expected to increase because of rising gas demand from domestic consumption and LNG exports. For a short while there are signs of greater convergence between North America and the rest of the world before Henry Hub flattens out just below the $5.50 per MMbtu level.
We can expect shale gas production in North America to continue to increase, supporting LNG export projects and domestic consumption, offsetting the decline in conventional gas output. By 2035, shale gas will represent 56% of North American output. A noteworthy consequence of burgeoning shale production, particularly the Marcellus Shale, is the changing flow patterns within the United States.
The historically import dependent Northeast eventually becomes a pipeline and LNG exporter at the end of the decade. This will change the basis differentials of the Northeast hubs to Henry Hub over the medium to long term.
The Northeast hubs have tracked Henry Hub at some sort of premium until now but the differentials are narrowing and will continue to do so until 2015 when most prices are expected to slip below Henry Hub prices. Over the longer term the discount of the Dominion South hub to Henry Hub is expected to average $0.80 per MMbtu.
This scenario makes a case for the export the LNG from North America but it is important to recognize the uncertainty attached to these forecasts. The result of our latest simulation is that Henry Hub prices rise from about $4 per MMbtu in 2016 to peak at $5.55 per MMbtu in 2027 in real 2012 prices. This could change if, for example, U.S. demand transpired to be higher than we assumed, possibly giving rise to a deeper price response up the supply curve.
A faltering in the supply base from North America or other future growth areas such as FSU, Asia, Middle East and Africa would affect exports and tighten the market and put upward pressure on spot prices. The same can be said for capacity additions, especially post-2020. They remain highly uncertain and sustained periods of excess capacity may lead to further postponement of projects again tightening the market.
The level of LNG exports that will actually emerge could change, too. Based on current projects, 78 Bscm are expected to be exported by 2035 – giving a load factor of 88%. This volume could be reduced if differentials between the United States and Europe or the Far East narrow. There is also great uncertainty brought about by expiring term contracts over the next few years and the basis upon which they will be renewed going forward.
Will there be further moves away from oil indexation as has already happened to a significant extent in Europe? Will U.S. hub-indexed LNG be the catalyst Asia needs to change?
With uncertainty surrounding the factors dictating the path and impact of North American LNG exports, there are risks to be mitigated.


Comments