
December 2013, Vol. 240 No. 12
Features
Implications Of U.S. Natural Gas Growth: Will Gas Bills Be Cheaper?
What many have called “the natural gas revolution” is a game changer not only for North American energy but potentially for the rest of the world. The two main factors in propelling commodities from local to global resources are logistics and technology.
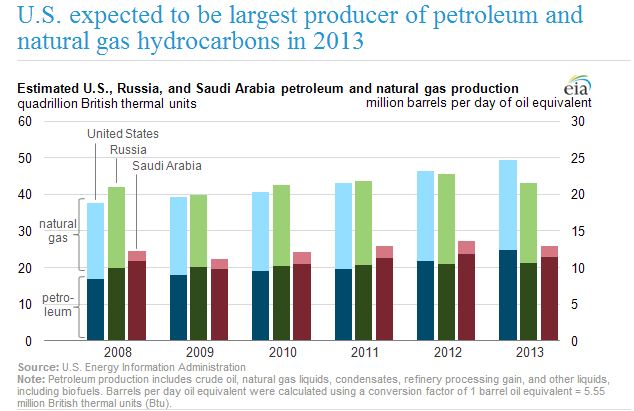
According to a recent U.S. Energy Information Administration (EIA) report, the U.S. is expected to be the biggest producer of natural gas in 2013. So does that mean residential gas bills will be cheaper? Will there growth of U.S. natural gas into a global commodity?
Although U.S. natural gas production is set to surpass Russia and Saudi Arabia, natural gas is one of the most difficult and expensive commodities to store and transport.

There are only 10 major locations that shows the production across the U.S. with the highest growth coming from the northeast, but the challenge is to store and transport the natural gas.
Pipelines are difficult and costly to build, not only the actual construction, but also the feasibility analysis, permitting and regulatory processes that must be completed for safety and environmental reasons.
Even when these projects are approved and constructed, they are complicated by requirements to compress and check the gas with meters and valves along the way. Since the major trading locations don’t match perfectly with the pipelines in place for transportation and storage, there is a need to expand the infrastructure to move the natural gas.

Source: U.S. Energy Information Agency
One way to see the high costs of storage and transportation through indexing is to look at the negative roll return by subtracting the spot return index (PR) from the excess return index (ER). However, before examining the history of these costs, let’s review the definitions of the spot and excess return indices.
The S&P GSCI Natural Gas is a sub-index of the S&P GSCI that includes only the natural gas commodity from the broad-based index. The spot version reflects only the prices of the included contracts with the first nearby expirations, or the roll period expirations during the roll (when the index exits the expiring contracts and includes contracts with the new roll period expirations).
The spot index level calculation does not incorporate the premium or discount obtained by rolling positions forward as delivery approaches. It also does not include interest earned on any fully collateralized contract positions on the commodities. The version of the index that does include the premium or discount obtained by rolling positions forward as delivery approaches but does not include interest earned on any fully collateralized contract positions on the commodities is called the excess return index.
Therefore, by taking the difference of returns of the spot from the excess return index, the roll costs are isolated where a more negative result indicates higher storage and transportation costs.
Two things of note (see “Roll Yield” chart) are there has not been a significant positive roll yield since February 2003, and there is a recurring high seasonal cost in the September-November period.

Data from December 2002 to October 21, 2013. Past performance is not an indication of future results. This chart reflects hypothetical historical performance.
Source: S&P Dow Jones Indices
Also notice the average the roll costs are higher on average in September-October period than during the rest of the year. The average cost of storage and transportation for the month of October has been declining since 2009, and that October 2013 had the lowest October roll cost since 2005.

Data from December 2002 to October 2013. Past performance is not an indication of future results. The chart reflects hypothetical historical performance.
Source: S&P Dow Jones Indices.
Not only has the roll cost of natural gas declined, but the price as reflected in the S&P GSCI Spot Index Level is also down to 61.7 from a starting point of 100 on Dec 31, 2002. As a general measure of the market, the index levels fall in-between the residential and wholesale prices, so either or both of those prices fell.

Data from December 2002 to Oct. 21, 2013. Past performance is not an indication of future results. This chart reflects hypothetical historical performance.
Source: S&P Dow Jones Indices.
Both residential price and wholesale price of natural gas have fallen. However, residential declined much less than wholesale. The reason can be partially explained by the reduced storage and transportation costs. Nonetheless, the technology and future transportation logistics are expensive, and it is the retail consumer that bears the brunt of the cost.

A significant portion of residential gas bills come from the cost of building and maintaining pipelines. Since those costs don’t drop when natural gas prices fall, the prices consumers pay for gas haven’t fallen nearly as much as the wholesale price. While U.S. natural gas prices have remained relatively low post-2008 as a result of new production technology and a lack of pipeline infrastructure that led to excess supply, the cost of new incremental production may become more expensive as more easily accessible reserves are depleted. From this, the U.S. EIA estimates Henry Hub spot prices for natural gas will increase by an average of 2.4% annually, to $7.83 per million Btu (2011 dollars) in 2040.

As for the question of whether U.S. natural gas can grow into a global commodity, that may depend on where the heaviest investment is spent. Many companies that produce goods out of natural gas are eagerly building facilities to take advantage of low prices, but that will cut into inventory, eventually driving prices up again if production can’t keep up with demand. Also, there are a few countries with larger natural gas reserves than in the U.S.

If these countries invest more heavily in exploration and production – or technology, than in logistics (China announced it will spend $13 billion for E&P), then the chance U.S. natural gas becomes global is less likely. Earlier in the year, there was news of a United Kingdom company signing a deal to bring U.S. natural gas to U.K. homes, which may help the U.S. natural gas globalization, but then the real question may become “How long it will last?”
Author:
Jodie M. Gunzberg is vice president at S&P Dow Jones Indices. Gunzberg is responsible for the product management of S&P DJI Commodity Indices, which include the S&P GSCI® and DJ-UBS CI. Gunzberg is a former director of the Board of Directors for CFA Chicago. She received her master’s degree from the University of Chicago, Booth School of Business, and earned a bachelor’s degree in mathematics from Emory University.

Comments