
September 2012, Vol. 239 No. 9
Features
FERC Market Study Shows Growing Demand For Natural Gas
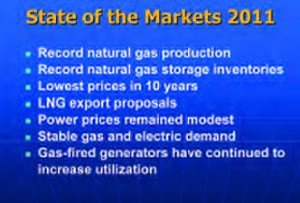
The Federal Energy Regulatory Commission’s recently released State of the Markets 2011 report provides insight into the nation’s plentiful supply of natural gas, the need to develop new domestic and foreign markets and what’s driving changes in electric markets.
One of the most positive findings of the report is that natural gas production reached an all time record high in 2011, surpassing levels last seen in the 1970s, Fig. 1.
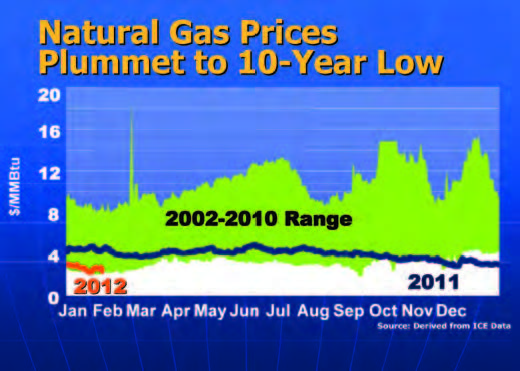
Because growing supply outpaced demand and led to record high natural gas storage going into the 2011/2012 winter, the report notes that natural gas prices fell to lows not seen since the early 2000s. Plentiful natural gas supply and low prices led to talk of the need to develop new domestic and foreign markets for natural gas and in 2011 seven LNG export projects were proposed in the U.S. with almost 14 Bcfd of capacity.
The study found that electric markets also experienced low prices as fuel costs fell and demand remained stable. Changes in the pricing relationship between natural gas and coal fired generators caused a fundamental shift in the utilization of these plants, with natural gas plant production increasing and coal plant output falling.
The accompanying Fig.2, provided by the study’s authors, compares the current Henry Hub natural gas spot price (shown in red) to the ten-year range (shown in green) to illustrate how prices fell below that range towards the end of 2011.
Also noted in the report is the most recent Nymex forward curve for natural gas that shows the market anticipates prices at Henry Hub remaining under $4/MMBtu through 2014. Findings also indicate that some natural gas producers have voiced concerns that declining revenues due to low natural gas prices will affect their ability to explore for and produce natural gas. Moreover, some producers have announced plans to cut back natural gas production and drilling in gas-onlygas only shales while increasing drilling in shales rich in natural gas liquids.
The report warns that these are trends that need to be followed closely throughout 2012.
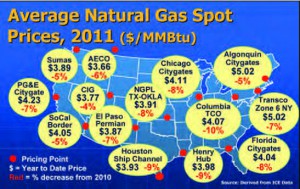
As illustrated in Fig. 3, all pricing points declined in 2011. Average natural gas spot prices declined across the country by around 7% in 2011.
Findings in the report relating to pipelines show that new pipelines completed during 2011 linked growing supply sources to markets and contributed to shrinking regional price differences. In some cases the market price of natural gas between regions declined to less than variable transportation costs.
When prices drop below the variable cost of transportation, it becomes uneconomical to move natural gas to try to capture price differences between pricing points, the report said. Also noted is a decline in the seasonal difference between winter and summer natural gas prices. Falling seasonal spreads reflect increased production and storage capacity, as well as greater year-round use of natural gas by power generators. This decline that has developed over the past several years is expected to continue.

Other findings explain how the transportation capacity values dropped on many long-haul pipelines last year as strong production growth in the Marcellus and other shale basins displaced some natural gas flows from traditional supply basins, Fig. 4. For example, Rockies natural gas flows to the Northeast on Rockies Express Pipeline (REX) declined more than 40% since early November 2010, from 1.7 Bcfd to 1 Bcfd. The decline was so severe that S&P reduced REX’s credit rating. The study attributes the downgrade to persistent low profitability in shipping Rockies natural gas eastward, which has occurred because Rockies natural gas has been displaced in the Northeast by increased flows of less-expensive Marcellus Shale gas from Pennsylvania. Also, the new Ruby pipeline competed with REX providing Rockies producers access to a more profitable market in Northern California.
S&P said that lower profitability now has increased the recontracting risk on REX as well. As with the Rockies, traditional U.S. Gulf Coast supplies have been displaced by largely liquids-rich Mid-Continent production.
The report also states that in 2011, FERC jurisdictional natural gas pipeline companies added roughly 2,100 miles of new pipe or about 9.3 Bcfd of transportation capacity, while major intra-state pipelines added another 400 miles of new pipe and 4.7 Bcfd of transportation capacity.
The six largest projects, shown on the map, accounted for 57% of new transportation capacity. Major projects include Ruby Pipeline, Florida Gas Transmission Phase VIII Expansion and the Bison Pipeline. In 2011, pipeline developments shifted to projects focused on relieving local bottlenecks in new producing basins rather than long-haul pipelines. Most are located in the Northeast and Southeast and include the Tennessee Gas Pipeline Line 300 Expansion, the Texas Eastern TEMAX/TIME III project and the Acadian Haynesville Extension, an intrastate pipeline which feeds into the Henry Hub.
Other Report Findings:
- Dry gas shales, such as the Haynesville in North Louisiana, the Fayetteville in Arkansas and the Barnett in the Dallas/Fort Worth area, remained the largest producing shales in 2011. However, the fastest growing shales were found in the liquids-rich shale basins. The Marcellus Shale is a liquids-rich play in parts of Pennsylvania and West Virginia and production doubled over the year to nearly 6 Bcfd by the end of 2011.
- Production from the Eagle Ford Shale in South Texas grew 64% to 3 Bcfd over the same period, the highest growth of any shale. Some Eagle Ford wells produce as much as 70% natural gas liquids, which can double profitability compared to a gas-only well.
- The rapid increase in natural gas liquids production outstripped liquids processing and takeaway capacity in many regions, resulting in development and production bottlenecks for both natural gas and liquids. The liquids infrastructure in the Appalachian region was not designed to handle the volumes produced by the Marcellus Shale. The Eagle Ford Shale in Southeast Texas faces similar problems. Industry plans to add over 700,000 bbls of fractionation and processing capacity and 1.3 million barrels per day of liquids pipeline takeaway capacity by 2014 to alleviate these bottlenecks.
- Low prices and the drive to tap shale gas reserves have touched off a race to reduce drilling costs and improve rig operating efficiency. These improvements resulted in production increases even as the natural gas rig count declined. In 2011, the natural gas directed rig count dropped 6%, even as production increased. There are many shale gas wells that have been drilled but not completed because producers are waiting for higher prices. This will enable gas production to come on-line quickly as market conditions warrant.
The report also finds that concerns regarding environmental issues associated with hydraulic fracturing remained at the forefront in 2011. At the federal level, the Environmental Protection Agency continues its study of the relationship between hydraulic fracturing (fracking) and drinking water with its final study plan released in November 2011 and the final results not expected until 2014. At the state level, actions on fracking range from outright bans, such as the one in the New York City watershed, to the reassessment of current regulations in Ohio, as that state prepares for oil and natural gas development in the Utica Shale.
The report also provides an overview of the nation’s natural gas consumption, power prices, FERC Order 720, increased natural gas-fired generation use, the strong growth in renewable and assesses the impact of LNG exports on U.S. natural gas prices.

Comments