
November 2011, Vol. 238 No. 11
Features
P&GJ's 31st Annual 500 Report: Shale Resources Continue To Improve U.S. Natural Gas Outlook

Pipeline & Gas Journal’s 31st Annual 500 Report is the industry’s most detailed statistical listing of the nation’s energy pipeline systems. As in past years, the report ranks the nation’s top liquids, gas transmission and gas distribution systems. Gas transmission companies are ranked by total miles of pipe while the rank of each liquids pipeline company is determined by yearly crude deliveries.
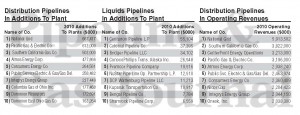
Additional statistical data compiled for the report are based on operating revenue; net income; total throughput of natural gas; barrels of crude and refined products delivered; miles of mains and service lines; and additions to plant.
More than 95% of the data presented are based on information from calendar year 2010, compiled through forms filled out by each company listed or data collected at the Federal Energy Regulatory Commission (FERC).
P&GJ makes every effort to provide the latest statistical information available. If your company’s information is incorrect, let us know. We also need to know about any change of address or contact information.
Industry Trends
According to the EIA Annual Energy Outlook 2011, the United States possesses 2,543 Tcf of potential natural gas resources. Natural gas from shale resources, considered uneconomical just a few years ago, accounts for 862 Tcf of this resource estimate, more than double the estimate published last year. At the 2010 rate of U.S. consumption (about 24.1 Tcf per year), 2,543 Tcf of natural gas is enough to supply over 100 years of use. Shale gas resource and production estimates increased significantly between the 2010 and 2011 Outlook reports and are likely to increase further in the future.
In its natural gas outlook, the EIA expects marketed natural gas production to average 66 Bcf/d in 2011, a 4.2 Bcf/d (6.7%) increase over 2010. The entirety of this growth is coming from increases in onshore production in the lower 48 states which will more than offset a steep year-over-year decline of over 0.9 Bcf/d (15%) in the federal Gulf of Mexico (GOM) and a small decline in Alaska. EIA expects that overall production will continue to grow in 2012, but at a slower pace, increasing 1.4 Bcf/d (2.1%) to an average of 67.4 Bcf/d.
The EIA report indicates growing domestic natural gas production has reduced reliance on natural gas imports and contributed to increased exports. EIA expects that pipeline gross imports of natural gas will fall by 4.8% to 8.6 Bcf/d during 2011 and by another 3.1% to 8.4 Bcf/d in 2012. Projected imports of LNG fall from 1.2 Bcf/d in 2010 to 0.9 Bcf/d in 2011 and to 0.7 Bcf/d in 2012.
The report notes the Henry Hub spot price averaged $3.90 per MMBtu in September 2011, 15 cents lower than the August 2011 average. EIA projected the Henry Hub spot prices to fall further in October before rising above $4 per MMBtu in December. This month’s Outlook lowers the 2011 forecast by 5 cents to $4.15 per MMBtu, 24 cents less than the 2010 average.
Oil prices continue to face upward price pressure due to supply uncertainty and downward price pressure because of lowering expectations of economic growth. Upside uncertainty is a result of unrest in oil-producing regions. Turmoil in Syria, which produced an average 400,000 bpd in 2010, and the potential for more sanctions on the country’s energy sector is one source of risk to non- OPEC supply. Downside demand risks also continue over fears about the rate of global economic recovery, effects of the debt crisis in the European Union, and other fiscal issues facing national governments. On the supply side, there may be downward price pressure if Libya ramps up oil production and exports sooner than anticipated.
EIA expects the U.S. refiner average crude oil acquisition cost will average about $99 per barrel in 2011 and $98 per barrel in 2012, compared with $100 per barrel and $103 per barrel for 2011 and 2012, respectively.
Its forecast for West Texas Intermediate (WTI) sees a continuation of the significant price discount for WTI relative to other U.S. and world crude oils until transportation bottlenecks restricting the movement of crude oil out of the mid-continent region are relieved. Consequently, the projected average U.S. refiner acquisition cost of crude oil, which averaged almost $2.70 per barrel below WTI in 2010, averages about $7 per barrel above WTI in 2011 and $10 per barrel above WTI in 2012.
Survey Results

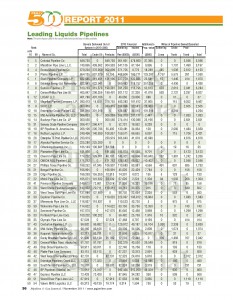
Liquids’ Top Ten.
Overall, not much has changed over the past year in the liquids pipeline category. Colonial Pipeline again claimed the highest number of product deliveries, reporting 849,730,000. SFPP also retained the second spot, reporting 389,478,000, while Magellan Pipeline moved from the fourth position last year to third place with 378,755,000. Mid-American Pipeline moved from sixth to fourth position with 306,833,000, while Marathon Pipe Line ranked fifth, reporting 304,333,000. The sixth and seventh positions were claimed by Exxon/Mobil Pipeline, 302,999,000 and Buckeye Pipe Line, 300,560,000.
The purchase of Teppco Partners (LP) by Enterprise Products Partners resulted in the only new addition to the top ten in this category. Renamed Enterprise TE Products Pipeline Co. LLC, the company reported 233,979 bpd to claim the eighth position.
The ninth and tenth rankings went to ConocoPhillips with 199,491,000 and Sunoco Pipeline reporting 198,381,000.
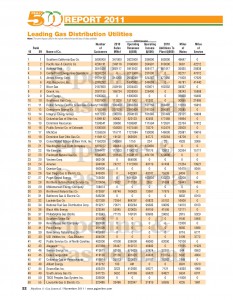
Distribution’s Top Ten.
Little change is seen in this year’s top ten distribution companies in terms of number of customers. Southern California Gas again claimed the top spot with 5,800,000 and Pacific Gas & Electric retained second place with 4,295,741. National Grid moved from the number four spot to claim third place with 3,510,436. Although some of the overall customer numbers changed for some, fourth through tenth positions were again claimed by the following companies: CenterPoint Energy, 3,263,224; Atmos Energy, 3,178,112; AGL Resources, 2,269,292; Nicor Gas, 2,187,600; Oneok Inc., 2,081,135; Xcel Energy, 1,900,000; and Southwest Gas Corp., 1,837,000.
Editor’s note: The top results in our 500 reports are reproduced below. For full listings, see the print version of the magazine (November 2011, Vol. 238 No. 11) or contact our offices to purchase the compiled data.


Comments