
November 2010 Vol. 237 No. 11
Features
Higher Natural Gas Consumption And Improving Economic Conditions Improve U.S. Outlook

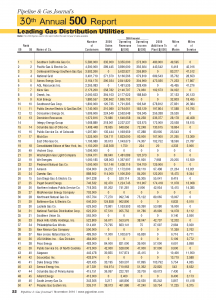
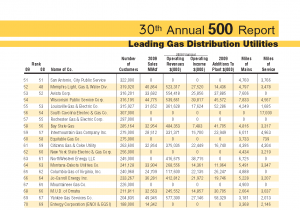
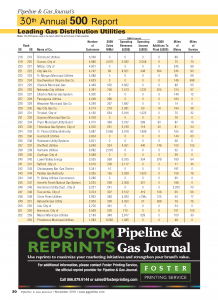
Pipeline & Gas Journal’s 30th Annual 500 Report is the industry’s most comprehensive statistical review of U.S. energy pipeline systems. As in past years, the report ranks the nation’s top gas distribution, liquids and gas transmission systems. Transmission companies are ranked by mileage while the rank of each liquids pipeline company is based on yearly crude deliveries. The gas distribution rankings are based on number of customers.
Additional statistical data compiled for the report are based on operating revenue, net income, total throughput of natural gas, barrels of crude and refined products delivered, miles of mains and service lines and additions to plant. More than 95% of the statistical data presented is based on information from calendar year 2009, compiled through forms filled out by each company listed or data collected at the Federal Energy Regulatory Commission (FERC). While extensive efforts are made each year to provide the latest statistical information available, some companies are no longer required to provide statistical data to the FERC and failed to respond to our inquiries.
As a result, we are using the latest information available to us. If your company’s information is incorrect, let us know. We also need to be made aware of any changes of address, contact information, mergers and acquisitions.
Energy Outlook
Higher natural gas consumption and improving economic conditions are both forecast in the U.S. Energy Information Administration’s latest Short Term Energy and Winter Fuels Outlook, released Oct. 13, 2010. In fact, the report notes that marketed natural gas production in the lower-48 states is expected to rise by 3.5% this year. For 2011, EIA expects total U.S. marketed natural gas production to decrease by 1.5%, less than the 1.9% reduction forecast in last year’s Outlook.
The EIA data forecast gross pipeline imports of 9.2 Bcf/d in 2011, an increase of 1.5% compared with 2010. Forecasted imports of LNG average 1.23 Bcf/d in 2010, a slight decline from 2009 levels. Nevertheless, EIA expects LNG imports to grow slightly in 2011 to 1.32 Bcf/d, a 7% increase. On total natural gas consumption, the report projects increases of 4.6 % and 0.1% in 2010 and 2011, respectively. Moreover, consumption of natural gas in the industrial and electric power sectors make up the bulk of the year-over-year increase in consumption in 2010.
The report states that projected industrial natural gas consumption rises by 7.4% in 2010, driven by the projected 6.7% increase in the natural-gas-weighted industrial production index. The forecasted 7.6% growth in 2010 natural gas consumption in the electric power sector is seen as partially due to the very warm summer weather, which led to an increase in electricity demand for cooling. Estimated natural gas consumption for electric power through August 2010 averaged 20.75 Bcf/d compared with 19.23 Bcf/d through August 2009, a 7.9% increase.
According to the report, the projected 0.1% increase in total natural gas consumption in 2011 is the result of about a 1% increase in residential, commercial, and industrial natural gas consumption, offset by a 1% decline in electric power sector consumption. The projected increase in residential and commercial consumption next year is the result of a forecasted 1.7% increase in U.S. population-weighted heating degree-days. Industrial sector natural gas consumption growth is driven by the projected 2% increase in the natural-gas- weighted industrial production index. Despite a slight decrease (0.3%) in electricity consumption in 2011, projected electric-power-sector natural gas consumption falls by1% primarily because of forecasted increases in nuclear and renewable-based electricity generation.
The report says the Henry Hub spot price averaged $3.89 per MMBtu in September, $0.43 per MMBtu lower than the average spot price in August. The Outlook notes that prices are expected to remain below $4 per MMBtu in October but rise to $4.68 per MMBtu by January as space-heating demand increases this winter. EIA has also revised its projections for natural gas prices downward through 2011. Price expectations for 2011 are $4.58 per MMBtu, which is $0.18 per MMBtu (4%) lower than last month’s forecast, primarily due to a stronger domestic production forecast.
In the EIA’s crude oil production outlook, domestic production, which increased by 410,000 bpd in 2009, is projected to increase by 100,000 bpd in 2010. Conversely, total domestic crude oil production is projected to fall by 60,000 bpd to 5.4 MMbpd in 2011. This projection includes a 170,000 bpd decline in the Federal Gulf of Mexico and a 130,000 bpd increase in lower-48 non-GOM production next year. On crude prices, the EIA expects the price of West Texas Intermediate (WTI) to average about $80 per barrel this winter, a $2.50-per-barrel increase over last winter. The forecast for average WTI prices rises gradually to $85 per barrel by the fourth quarter of 2011 as U.S. and global economic conditions improve.
Survey Results
Distribution’s Top Ten. For perhaps the first time, no change has been seen in the top ten distribution rankings over the past year, with Southern California Gas claiming the top spot with 5,800,000 customers. While the overall number of customers changed for some, the second through tenth positions were once again claimed by: Pacific Gas & Electric, 4,300,000; CenterPoint Energy Southern Gas Ops, 3,992,266; National Grid, 3,491,719; Atmos Energy Corp., 3,164,176; AGL Resources Inc., 2,265,083; Nicor Gas, 2,176,200; Oneok, Inc., 2,060,653; Xcel Energy, 1,880,557; and Southwest Gas Corp., 1,800,000.
Transmission’s Top Ten. While last year’s top ten transmission companies were all able to retain a spot in the rankings this year, only three were able to hold on to their old rankings: El Paso retained its number one position with 5,530,679 Dth*, while Transcontinental Gas Pipe Line held on to fourth place at 3,089,882 and Natural Gas Pipeline retained the sixth spot with 2,481,770. Columbia Gas Transmission moved from third to second, reporting 4,143,737, while Columbia Gulf Transmission took third, reporting 4,135,755. Texas Gas Transmission claimed the fifth spot, at 2,684,369. The seventh through tenth positions were claimed by ANR Pipeline, reporting 2,455,590, Tennessee Gas Pipeline, 1,992,417, Gulf South Pipeline, 1,689,673 and CenterPoint Gas Transmission, 1,677,076. Liquids’ Top Ten.
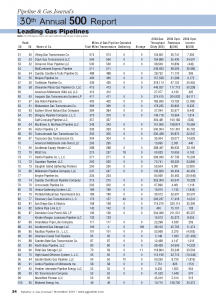
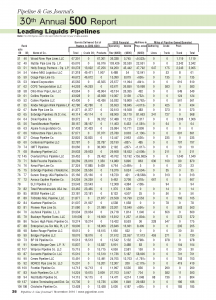
Little change has been seen in the top ten companies in terms of product deliveries by liquids companies over the past year except where the companies fall in the new rankings. The new rankings saw Shell Pipeline Company report 852,849 bbls to move from the second spot a year ago to claim the first spot this year. Plains Pipeline dropped from the number one spot last year to take second with 735,564 bbls, while Enbridge Energy Ltd. claimed the third position with 623,518 bbls. The fourth through eighth spots went to: Marathon Pipe Line, 466,724; ExxonMobil Pipeline, 376,249; LOCAP LLC, 282,168; and BP Pipelines North America, 282,168. This year’s ninth position was claimed by Alyeska Pipeline Services that delivered 245,290 bbls, while Sunoco claimed the tenth spot with 232,944 bbls.
*Transmission production figures that appear in the report are reflected in dekatherms.


Comments