
September 2009 Vol. 236 No. 9
Features
New Measurement Data Has Implications For Quantifying Natural Gas Losses From Cast Iron Distribution Mains
The loss of natural gas from oil and natural gas systems is a global environmental concern given that methane, the primary component of natural gas, is a powerful greenhouse gas over 20 times more potent than carbon dioxide.
This loss has economic, efficiency, safety, and energy supply implications, in that a valuable, non-renewable hydrocarbon resource is being lost forever.
Natural gas is most valuable when it has been processed to pipeline quality and transported to local distribution systems for delivery to end users. A significant source of natural gas losses from distribution systems is cast iron distribution pipes. U.S. cast iron distribution mains are estimated to have leaked 9 billion cubic feet (Bcf) of natural gas in 2007. This equates to $150 million worth of gas, assuming the average U.S. distribution price in 2007 , , or $50 to $115 million if gas were valued between $3 and $7 per thousand cubic feet (Mcf).
In the U.S. and abroad, quantifying natural gas losses is the first step to mitigating losses and conserving this valuable resource. The U.S. Greenhouse Gas Inventory estimates natural gas losses from cast iron distribution mains utilizing leak factors determined in a study commissioned by the U.S. EPA and the Gas Research Institute (EPA/GRI). Notably, this study impacts global emissions estimates, as the EPA/GRI study leakage rates serve as default emission factors in the Intergovernmental Panel on Climate Change guidelines for 2006.
New data on leakage rates from cast iron distribution pipelines highlights the potential variability of actual leakage rates worldwide. Since 2005, Comgas, the largest natural gas distribution company in Brazil by distribution volume, has measured leak rates from 912 segments of cast iron pipelines and discovered significantly larger leak rates than the EPA/GRI study. These results point to the need for further study in order to accurately gauge emissions levels from individual distribution systems.
This article will compare methodology and results of the Comgas measurement studies and the EPA/GRI study. In both cases, the need to address leakages from cast iron distribution pipelines is apparent and mitigation options employed by Comgas and other distribution companies will also be discussed.
Background
Cast iron was the material of choice for low pressure distribution mains in the U.S. until the 1950s. Pipelines typically consist of 12-foot sections connected by bell and spigot joints, shown in Figure 1 , that are sealed by jute packing plus cement or molten lead. Leaks tend to develop in the packing over time due to heavy overhead traffic, freeze-thaw cycles, naturally shifting soil, and the switch to dryer natural gas.
Fugitive methane emissions from distribution mains account for 32% of methane emissions from the U.S. natural gas distribution sector. Cast iron pipelines contribute the most to these emissions, despite representing only 3% of the miles of the U.S. distribution mains 1 . These estimates are based on methane leak rates from an EPA-commissioned study to estimate emissions from all sources in the U.S. natural gas industry 4. GRI led the study and relied heavily on extrapolating emissions measurements conducted in 1992.
To evaluate leaks from cast iron mains, GRI visited 21 sites volunteered by distribution companies in North America. It followed the path of the cast iron mains on the surface, monitoring the air for elevated concentrations of methane using a flame ionization detector. Any increase of two to three parts per million methane concentration above background air concentration was considered a leak. Detected leaks were centered by boring holes in the ground on each side of the pipe, and the point with the highest concentration was considered the probable location of the leak.
Next, GRI excavated at least 10 feet downstream and upstream of the leak and isolated the segment. It equipped the segment to receive gas passing through a meter to measure the flow rate. Once the segment returned to operating pressure, GRI measured the flow rate necessary to sustain that pressure. A pipeline segment with no leaks requires a certain flow rate to maintain operating pressure. The leak rate is equivalent to the difference between the measured flow rate to the leaking segment and the flow rate at which a non-leaking segment would sustain operating pressure.

The average leak rate per distance of cast iron pipeline surveyed was calculated to be 428,123 standard cubic feet (scf)/mile-year 4. With an average methane concentration of 93.4%, the methane leak rate is 399,867 scf/mile-year.
Comgas Leak Studies
It is useful to compare measurement studies by Comgas with those from the EPA/GRI study. Comgas is Brazil’s largest distributor of natural gas, servicing over 700,000 customers in 67 municipalities in metropolitan Sao Paulo with daily throughputs exceeding 490 MMcf. Its cast iron network, which is 50 years old or older, was installed to supply town gas. In 1993 Comgas converted to natural gas when new sources of gas became available to Sao Paulo through the GASAN pipeline. This change to dryer natural gas has resulted in drying of joints and increased operating pressure – both of which increased natural gas leakage.
Comgas recognized that this leakage would be detrimental both financially and environmentally. The renewal of their cast iron pipeline network is one of the key aspects of the operational asset support projects undertaken since 1999, when the concession agreement was signed with the Sao Paulo State Government.
To calculate the magnitude of gas loss, Comgas developed a systematic approach to measuring losses from segments of pipeline prior to repair. To conduct the measurements, Comgas employees isolated segments of the cast iron network due for renewal and used a manometer to record the segment pressure every three minutes to watch the pressure decay in the normal operating pressure range. Using the ideal gas law, Comgas calculated the total volume of leaked gas and plotted it against time, then fitted an equation. The derivative, or rate of change, of the equation is equivalent to the volumetric leak rate at a given time and pressure. Comgas evaluated the derivative of its fitted data for each segment at the time when the segment was at operating pressure. In other words, Comgas calculated the leak rate for each segment at its normal operating pressure.
As of May 2009, Comgas had sampled 912 segments and calculated its average leak rate to be 1.614 Liters/meter-hour (803,548 scf/mile-year) from cast iron pipelines at average operating pressure. In arriving at this average, Comgas took a conservative approach and excluded data points showing leak rates higher than 4 Liters/meter-hour (1,991,444 scf/mile-year), which represent 15.4% of the sample measurements. This approach was taken given that, in some cases, it was thought that the blocks at each end of the isolated segments were leaking or that gas may have escaped into unmapped service lines, thus creating inaccurately high leak estimates. Seeking reliable results that represent the current condition of leaks, Comgas updates the study monthly. To incorporate new data to its average leak factor, Comgas weights recent measurements over the past year.
Figure 3 illustrates the results obtained from Comgas and EPA/GRI studies. With 912 data points, Comgas provides a larger sample size and Comgas’ average leak rate is nearly double the EPA/GRI factor. To put this in context, it should be noted that, Comgas’ cast iron network is comparable to or younger than most U.S. cast iron networks. However, until 1993, Comgas’ system supplied town gas whereas U.S. lines initially delivered coal gas, later switching to natural gas. Both town gas and coal gas were wetter than the natural gas that replaced them.

Comgas Leak Mitigation Activities
During the first five years of the program, Comgas spent US$82 million to renew 250 km (155 miles) by inserting polyethylene pipes into the existing cast iron network – eliminating the equivalent of 125 MMcf per year of gas losses. Its goal is to continue replacing 30 km each year from 2005 to 2010.
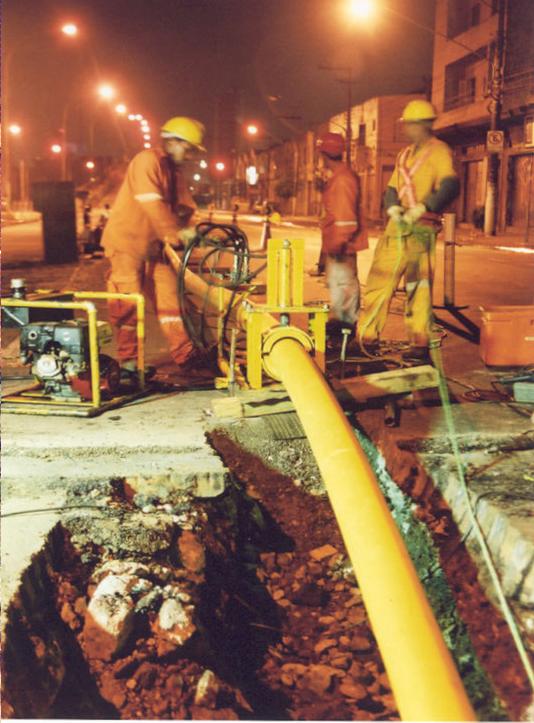
Each pipeline segment is renewed over three days. The first day, trenches are dug for launching and receiving ports for the plastic inserts. During the second day, service is interrupted to customers while the inserts are launched through the segment, and the segment is brought back online by connecting the internal plastic inserts and welding the cast iron skeleton to the adjacent cast iron segments. By the third day, service is renewed and trenches are refilled. Figure 2 shows Comgas employees inserting plastic liner into a cast iron segment. Comgas evaluated several mitigation options, but ultimately decided on plastic inserts for the following advantages:
- Elimination of leaks,
- Mitigation of risks during operations,
- Minimization of excavated trenches,
- Lower cost with improved productivity,
- Facilitated renewal of service lines,
- Polyethylene pipes are protected by old cast iron pipe, with possible use of pipe locator, and
- Ability to accommodate higher operating pressures and stabilization during peak demand periods.
Other Mitigation Options – Plastic Inserts
Comgas is an international partner in the U.S. EPA’s Natural Gas STAR Program, a voluntary partnership between the EPA and the oil and natural gas industry, designed to promote implementation of cost-effective methane emission reduction activities. Partner companies report methane mitigation activities to the EPA in order to promote technology transfer and capacity building throughout the industry. In addition to replacing networks with plastic pipeline, partners have reported inserting plastic liners. Thin-walled plastic liners take advantage of structural support offered by the cast iron parent pipe and provide the low leakage factors of plastic piping. Plastic liners can be pulled through long lengths of buried piping and bonded at joints to minimize leakage. Partners have reported on three lining methods: Starline, Rolldown, and Subline.
Since 1991, the Starline method has rehabilitated more than 250 miles of 4 to 24 inch distribution mains. This “cured in place” liner consists of a polyurethane adhesive mix outer layer enveloping a polyester woven liner and polyurethane internal coating. The pipeline system is first grit-blasted to clean it and create an adequate bonding surface. Adhesive is mixed and applied to the liner above ground, after which the inverted liner is propelled through the pipeline by compressed air or water so that as the liner unrolls inside out, the adhesive side is forced against the cleaned cast iron walls, creating a bond. The method takes approximately 1 hour to line sections up to 1,000 feet.
In the Rolldown method, individual polyethylene pipe liner lengths are fused onsite into appropriate lengths to suit particular site conditions and installation lengths. The pipe liner is drawn through roller dies to concentrically reduce the liner diameter, by about 10%, so that long, continuous lengths can then be inserted in a single operation. A single pull can insert liner for up to 5,000 feet of cast iron pipeline; however, a large insertion trench must be dug to allow the polyethylene insert to be drawn into the pipeline at a grade which will not compromise the liner. This method allows renewal of pipeline with diameters of 4 to 20 inches, and bends up to 11¼? can be negotiated. Once inserted, the ends of the liner are sealed off, and the liner is reverted to a close-fit by filling it with cold water and pressurizing it. The process requires excavations to reconnect pipeline segments.
The Subline process was developed to allow lining of large diameter pipes and improve the ability to negotiate bends. Polyethylene pipeline is folded in on itself along its central axis, making a “heart” shaped cross-section, so that it can be inserted into the cast iron pipeline. Similar to Rolldown method, long lead-in trenches are required for welded plastic strings and local excavations are required to reconnect the segment to adjacent sections. Subline allows for up to 3,300 feet of liner to be inserted in pipeline segments ranging from 3 to 64 inches; and the folded shape of the liner allows for bends up to 22½? to be negotiated. Once the folded polyethylene liner is inserted, pressurized cold water is used to revert it to a tight fit inside the pipeline with minimal reduction of capacity.
Other Mitigation Options – CISBOT
Natural Gas STAR partner company Consolidated Edison Company of New York (Con Edison) has reported implementation of another innovative approach for reducing losses from distribution mains. Con Edison supports ULC Robotics in the deployment of the Cast Iron Joint Sealing Robot (CISBOT). CISBOT is a live main sealing technology that can be used to seal joints in mains between 6 and 12 inches in diameter and can traverse up to 300 feet of pipeline through a single excavation (150 feet in each direction from the launching port.) It is equipped with a video camera with illumination, support arms, a drill head, and a sealant injector.
To use CISBOT, operators excavate a section of pipe and install a permanent fitting through which the robot’s launch tube is installed. The operator inserts CISBOT head-first into the launch tube through a valve (all with no gas escaping) and navigates it using the video camera with illumination to rehabilitate each joint starting at 150 feet away. To repair a leaking joint, CISBOT extends support arms to stabilize the robotic head, and it drills through the spigot into the joint seal at several points around the circumference of the joint. The drill bit is shaped to create a chamfer at the drill hole that allows the injection nozzle to create a clean, tight seal. Then anaerobic sealant is injected through the nozzle into the old jute, thus resealing the joint. Once the CISBOT system has completed the repair of joints within its 150-foot range, it is re-launched in the opposite direction.
CISBOT has patrolled Con Edison’s low-pressure cast iron network since 2000, sealing more than 5,000 joints. The robot minimizes excavation and repaving costs while eliminating any service disruption to customers. Con Edison estimates it reduced rehabilitation costs 30 to 40% over traditional trenched spot repair operations, particularly on streets that are about to be repaved.
Conclusion
The EPA/GRI and Comgas measurement study results show that the average volume of natural gas lost from cast iron distribution networks can vary and points to the need for further study of loss rates globally. Accurately assessing loss rates will help natural gas distribution companies prioritize maintenance activities and quantify resulting environmental, economic and efficiency benefits. By replacing cast iron mains with plastic pipeline, inserting plastic liners, or utilizing innovative technologies such as CISBOT, distribution companies can prevent much of this gas loss and reduce system maintenance costs associated with responding to citizen reported leaks. In addition to more efficient gas delivery to customers, companies are reducing losses of a valuable clean energy source and reducing emissions of methane, a potent greenhouse gas.
Carey Bylin is with the U.S. Environmental Protection Agency. She manages the Agency’s Climate Change Division’s domestic and international oil and gas work under the Natural Gas STAR Program and the Methane to Markets Partnership. Bylin.Carey@epamail.epa.gov.
Luigi Cassab is with Comgas. In 2009, he graduated in Mechanical Engineering at FEI University Centre. He works at Comgás Operational Area and supports all Control Room Area administrative activities.
Adilson Cazarini is responsible for all the Control System of Comgás Distribution Network, and leads the Control Room Area coordinating issues: natural gas supply and odorization, Loss Unaccounted Gas (LUAG) and distribution volumes estimation.
Danilo Ori is responsible for the operational remote control of Comgás’ distribution network and concentration control of odorant used for distribution of natural gas. He graduated in Mechanical Engineering at Maua School of Engineering, and in 2009.
Don Robinson is vice president of ICF International and manages the Oil & Gas Technology Group. For over 27 years he worked in the petroleum industry, both domestic and abroad, upstream and downstream, at Chevron, Arabian American Oil Company in Saudi Arabia and Mobil Oil Corporation.
Doug Sechler is an associate consultant with the Oil & Gas Technology Group in ICF International. Much of his work has been dedicated to scoping greenhouse gas emissions and analyzing mitigation strategies. He received a B.S. degree in Chemical Engineering and a minor in Chemistry from Penn State University.
2 EIA. Natural Gas Prices. April 29, 2009.
3 EIA. Natural Gas Consumption by End Use. April 29, 2009.
4 EPA/GRI. Methane Emissions from the Natural Gas Industry. Volume 9: Underground Pipelines. June 1996.
5 IPCC. 2006 IPCC Guidelines for National Greenhouse Gas Inventories.
6 EPA. Natural Gas STAR: Methane Emission Reduction Opportunities for Local Distribution Companies. July 16, 2008; slide 24.
7 Con Edison. CISBOT – Cast Iron Joint Sealing Robot. Presented at Natural Gas STAR 2008 Annual Implementation Workshop.
8 Starline TT. CIP Liners for Mains. 1999.
9 PIM Corporation. Rolldown Pipeline Renewal.
10 PIM Corporation. Subline Pipeline Renewal.
11 Con Edison, Natural Gas STAR. Methane Emission Reduction Opportunities for Local Distribution Companies. July 16, 2008.
References:
1 EPA. Inventory of U.S. Greenhouse Gas Emissions and Links: 1990 – 2007. April 2009.

Comments