
October 2009 Vol. 236 No. 10
Features
Enhanced Gas Leak Visualization Tools Accelerate Better Decision Making
For operators of underground transmission pipelines and/or aboveground natural gas processing facilities, finding and fixing “fugitive emission” leaks continues to be a business-critical task for safety, environmental stewardship, preservation of a finite resource and revenue enhancement. And for those engaged in natural gas exploration, finding and capturing methane emissions from naturally occurring underground sources is an additional motivation.
The question is: How can the process of finding leaks, emissions and seeps – and taking action on those findings – be accelerated? Increasingly, industry leaders in each of these segments are turning to companies which specialize in enhanced leak- and seep-detection and visualization tools needed to inform and guide critical business decisions in real time.
Visualizing Natural Gas Transmission Pipeline Leaks
Surveying underground natural gas pipelines for leaks remains critical to ensure public safety, continuity of service and environmental protection, not to mention necessary to comply with regulatory requirements. While gas lines have traditionally been leak-surveyed by walking the lines to measure for elevated concentrations of gases, this consumes a great deal of time and resources as well as putting the line workers’ safety at risk.
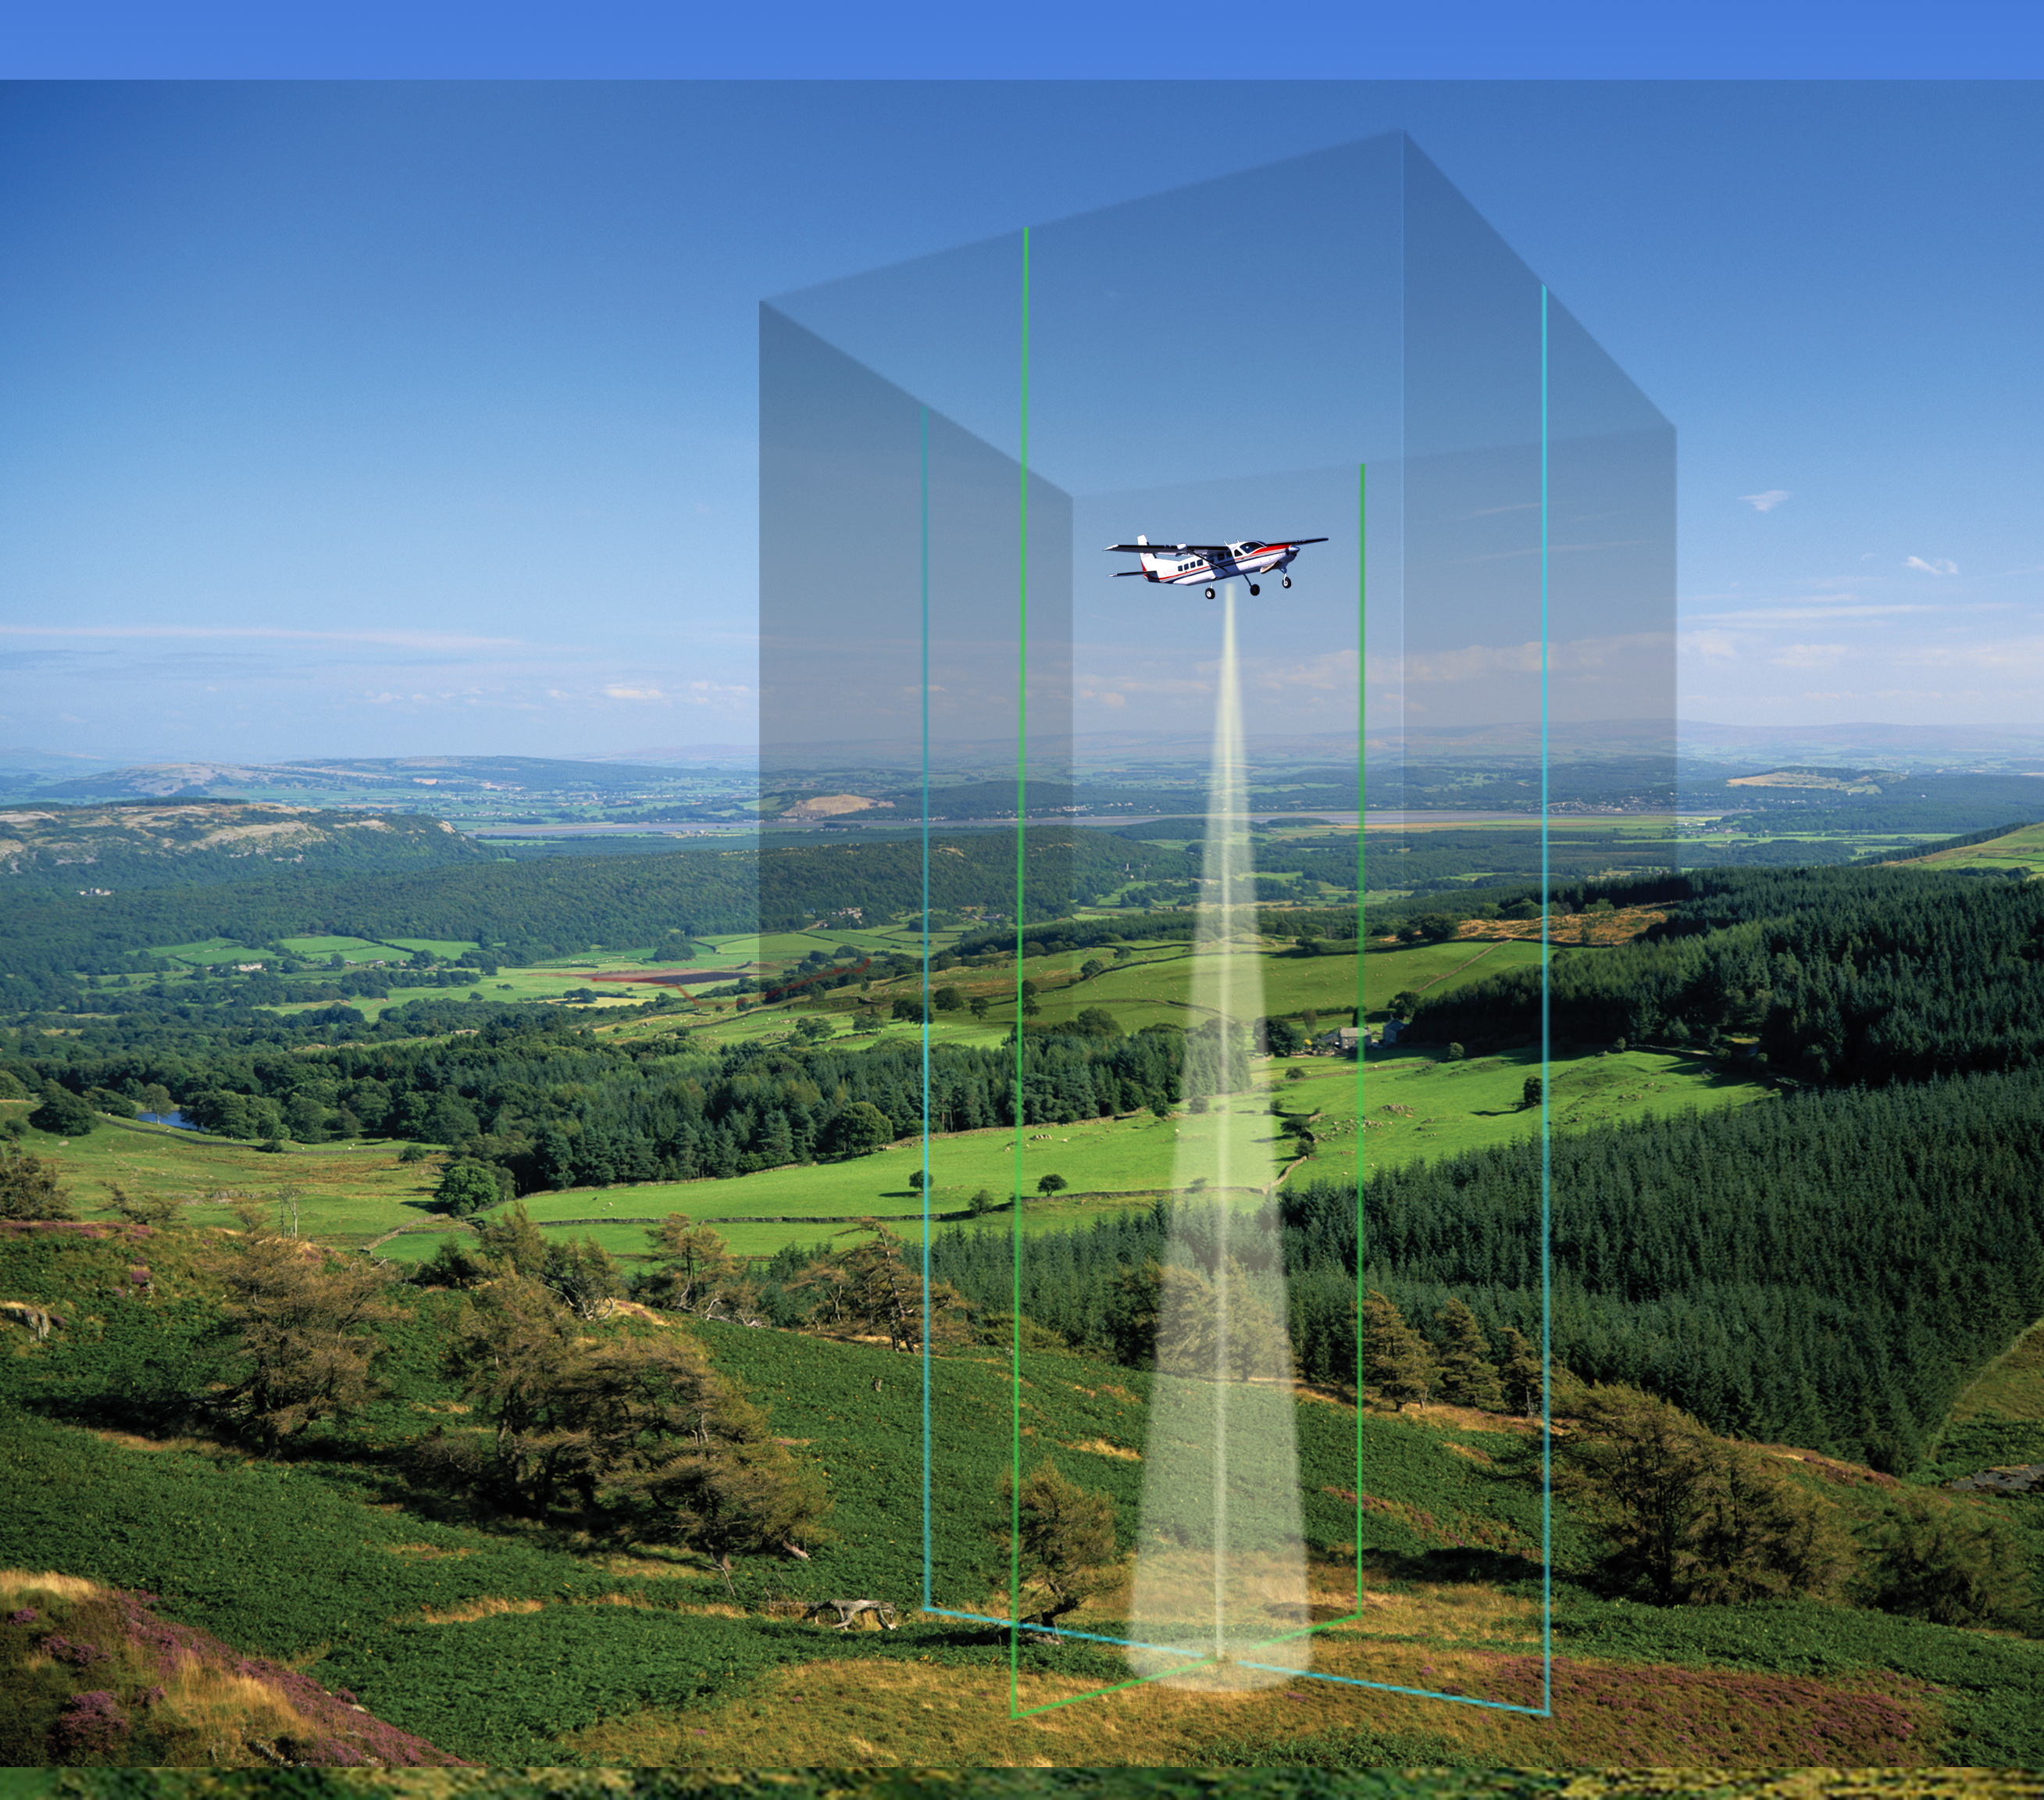
To address this ongoing challenge, ITT Corporation developed Airborne Natural Gas Emission Lidar (ANGEL) Services, delivering a safe, cost-effective way to aerially survey extensive networks of underground pipelines for leaks while maintaining a high level of accuracy and sensitivity. In the context of transmission pipeline surveys, customers say ANGEL Services combines the speed, efficiency and practicality of an aerial visual patrol with the confidence of an instrumented leak survey.
With a growing recognition that walking transmission pipelines in search of leaks is time-consuming and prone to missing leaks, the industry’s more progressive transmission pipeline operators have increasingly been turning to the advanced leak detection and visualization services. One such firm is Northern Natural Gas (NNG), headquartered in Omaha, NE.
NNG recognized the daunting task of walking its pipelines to fulfill its periodic pipeline leak-survey requirements to satisfy U.S. Department of Transportation regulations and selected ITT to perform aerial leak surveys over a specific pipeline segment. Jeff Cullison, regional pipeline specialist, said that decision was “based on proven accuracy as well as the short time duration to cover the network.”
On one survey flight over the NNG segment, a new underground leak indication was detected. Based on the data collected, NNG was presented with the exact spatial location and plume visualization of a major underground pipeline leak (Figure 1). Upon investigation, the leak represented a serious safety concern. “This crack probably wouldn’t have been discovered for another year – when the pipeline was next scheduled for inspection,” said Cullison. “Or, it would have split open.” But a pipeline integrity issue was quickly identified and a potential disaster averted.”
Figure 1: An example of an underground pipeline leak found and visualized – a two-dimensional visualization of a three-dimensional gas plume. (Courtesy of Northern Natural Gas)
This customer deliverable imagery visualizes:
- Methane gas detection and location.
- Gas concentration in ppm-m.
- Gas concentration contour mapping.
- Location and context of buried gas pipeline centerline.
- Color right-of-way mapping imagery, showing nearby structures and roadway.
- Differential Absorption Laser (DIAL) scan swath (the “blue ribbon”).
Visualizing Leaks At Processing Facilities
Just as with natural gas transmission pipelines, operators of natural gas facilities – such as compressor stations, gas-processing operations, etc. – must perform leak and emission surveys on each facility’s infrastructure periodically. While traditional methods of ground-based leak detection at facilities are time-consuming and prone to missing leaks, the reason many facility leaks are not detected differs from the reason walking surveys fail to detect underground pipeline leaks.
Equipment and infrastructure on gas processing facilities often rise dozens of yards into the air, including tanks, stacks, evaporators, condensers, etc. This infrastructure can deteriorate and begin to leak at any height, not just at ground level or even within reach of ground-based equipment and personnel. ANGEL Services provides an aerial leak survey that measures methane above background levels from the belly of the airplane all the way down to the ground. The visualization tools enable facility operators to precisely determine the spatial location of fugitive emissions – including a two-dimensional visualization of a three-dimensional gas plume – even when those emissions are far above ground and the reach of traditional equipment.
One natural gas transmission customer that contracted for airborne leak detection surveying is El Paso Corp., specifically on its Tennessee Gas Pipeline (TGP) network. In late 2008, ITT detected an emission at a TGP facility and provided the pinpoint leak location and visual imagery to support the find. Understanding that finding leaks on a facility can be a tricky task, Martin Melchor, principal analyst/compliance services director for El Paso, said, “What we’re looking for are fugitive gas emissions that occur where we might not be able to see them.”
Facility operators are driven to find and fix leaks for the same reasons as underground pipelines: safety, environmental stewardship and financial responsibility. Anders Johnson, director of planning and gas control for TGP, said, “It’s still not acceptable to have that loss of natural gas – from the environmental aspects and our fiduciary responsibility to those we’re delivering gas to.” Given methane’s physical properties, finding leaks can be challenging. “It’s clear – if you have a leak, many times you can’t see it,” echoed Johnson. ITT’s customer deliverables show the spatial location and plume visualization of the facility emission that ANGEL Services detected, including a quantified methane concentration contour map.

Figure 2: An example of the gas plume visualization made possible at a Tennessee Gas Pipeline facility. The image shows the gas concentration contours located on geo-referenced photo imagery of the facility area. (Courtesy of El Paso Corporation)

(Fig 3 caption) Figure 3: The same image as in Figure 2 is viewable on a handheld mobile device using visualization technology.
Visualizing Emission Sources
In natural gas exploration, coalbed methane is a prevalent source of naturally occurring methane gas that literally seeps out of the ground and into the atmosphere. Underground methane permeates natural coal formations and escapes in varying areas based on the geology of the terrain, changes to the water table and other activities that contain or release the trapped gas. Before the escaping gas can be captured for safety, environmental or revenue reasons, the exact location of those seeps must be found. Often these seeps are located across great expanses of rugged terrain affected by severe weather conditions.
One progressive organization that has contracted to exhaustively locate coalbed methane seeps is the Southern Ute Indian Tribe (SUIT) with landholdings in southern Colorado on a geologic formation named the Fruitland Outcrop. Historically, the SUIT employed ground-based walking survey teams to collect ground gas samples across this nearly 90-square-mile parcel of land. However, the sheer size of the area, difficult terrain and necessity of limited sampling meant not all methane seeps could be identified.
With private residences and commercial enterprises scattered throughout the Fruitland Outcrop, the safety of residents and visitors alike have motivated the SUIT to seek the best possible information on methane seep locations across their landholdings, including public lands. Secondly, the capture and sale of methane is a strong source of revenue for the SUIT. Thirdly, the capping of emission sources for future production is also an important environmental stewardship activity; as a greenhouse gas, methane has 20 times the warming potential of CO2.
In just a few weeks of actual flying time, ANGEL Services was able to survey the entire Fruitland Outcrop using its Cessna Caravan-mounted Differential Absorption Lidar (DIAL) sensor. An unprecedented approach to methane-seep detection, the 100% ground survey coverage gave the SUIT the confidence that no emission source was missed, thus satisfying their need for the utmost in safety and environmental stewardship.
The fusion of airborne emission survey data with the mapping imagery solution allowed the SUIT to clearly see the locations, intensity, characterization and direction of the gas plumes created by the escaping methane. With this critical information, the SUIT could prioritize the seep areas that would be capped for safety, along with those that would be capped for future gas production activity.
In the words of Kyle Siesser, SUIT geologist, “The work has provided the first ‘snap-shot’ of seep conditions along the entire Fruitland Outcrop in Colorado.” Bill Flint, SUIT senior petroleum engineer, offered a similar sentiment: “The aerial mapping enabled us to visualize these seeps and plumes for the first time, giving us a unique perspective on what was happening at ground level. They found a number of seep areas that we didn’t know we had.”
Figure 4 shows the aerial photo image of one section of the Fruitland Outcrop’s rugged terrain. SUIT is now able to visualize and see the physical size of all the seeps on their lands, combined with the varying concentration levels of those seeps.

Figure 4: An example of the high-resolution aerial photo-imagery collected by ANGEL Services, laid over a digital elevation model of the terrain. (Courtesy of Southern Ute Indian Tribe, ©SUIT 2009)
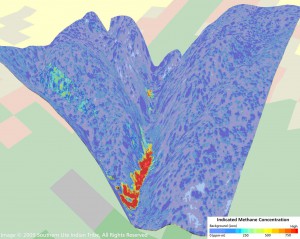
Figure 5: This image of the same area in Figure 4 shows ITT’s plume visualization, including methane emission emanating from the base of a valley. (Courtesy of Southern Ute Indian Tribe, ©SUIT 2009)
Proprietary DIAL Sensor
ANGEL Services employs a proprietary multimodal sensor payload designed to capture data and images as it performs airborne emission and leak surveys. The onboard Differential Absorption Lidar (DIAL) sensor detects gas leaks and the system also captures photo imagery from both a high-resolution mapping camera and a color digital video camera that helps operators verify leak and emission indications. But advanced data visualization, data fusion and image analysis technology are behind the true success of the ANGEL Services reporting system.
The custom software used to analyze and visualize ANGEL Services data was developed using software products from ITT including IDL, an advanced computing environment for data visualization and analysis, and ENVI, a leading software solution for image-processing and analysis. The custom software provides customers with visualized gas concentration levels and contours within a geo-referenced spatial image, yielding accurate, near real-time reporting of potential leak sources.
The final customer deliverable is a leak/emission survey report that clearly indicates the locations of higher-than-normal concentrations of methane, or “hot spots,” on a high-resolution photo image of the area. Those results are registered with existing geospatial data in the pipeline area of interest – such as the pipeline centerline – to create a final geo-referenced data product – ensuring a high level of leak/emission survey accuracy for reporting and mapping purposes.
This integration allows natural gas operators to easily import, select and analyze the results within their enterprise geographic information systems in support of integrity management regulation compliance, asset management and hazard notification. This data and imagery integration enables more timely and effective decisions in managing pipeline assets and safety.

Comments