
June 2009 Vol. 236 No. 6
Features
Third-Generation EMAT Tool Enhanced For Finding SCC And Disbonded Coating In Dry Gas Pipelines
This article looks at third-generation enhancements to electro-magnetic acoustic transducer (EMAT) inline inspection technology for dry gas pipelines. The enhancements have been derived from five years of operational experience by GE Oil & Gas-PII.
Since GE’s initial product launch of the EMAT tool, several hardware and analysis enhancements have resulted from the evaluation by engineers of more than a 1,000 km of EMAT tool pipeline inspections and 207 field confirmations of findings. These enhancements are now incorporated into GE’s new 30-inch, third-generation EMAT ILI tool.
Until 2002, conventional ultrasonic technologies were used for crack detection in liquid-filled pipelines. The application of the traditional piezoelectric transducers for inline inspection requires a liquid couplant for ultrasonic energy and signal transfer into the pipe wall. This requirement for a liquid couplant limits the cost-effective use of such tools for gas-filled pipelines. Filling the gas pipeline with a liquid for inspection or by batching the inspection tool in a liquid slug is–from a technical and operational perspective–not always feasible.
Electro Magnetic Acoustic Transducers (EMAT) are dry-coupled sensors. GE launched an inline inspection tool with EMAT sensors for 36-inch pipelines in 2002. Locating most of the key crack features identified earlier by the benchmark ultrasound crack detection tool, the initial launch inspection was considered a success. However, further inspections encompassed a larger sample set of the pipeline population with its broader variety in pipe conditions and environment which uncovered certain limitations in the design from achieving the expectations set by the historical performance of the ultrasound crack detection technology. The 36-inch EMAT tool has now completed over 1,000 km of inspections with operators in the U.S. and Canada. Results of these inspections have been confirmed with more than 200 field verifications.
This initial launch of 36-inch EMAT tool has demonstrated the significant potential of the EMAT technology for use in inspection of gas pipelines without a liquid coupling and for location of a wider range of defects with better accuracy than the niche technologies of Transverse Flux Induction (TFI) and wheel-coupled ultrasound tool, respectively. By overcoming the shortcomings of this first generation, EMAT seeks to provide a financially superior option to hydrostatic testing.
The latest generation of EMAT crack-detection tool is a new design which incorporates lessons learned from operational experience. The tool delivers an enhanced set of performance requirements which were quantified up front by pipeline operators.

Table 1: Performance comparison of EMAT tool GEN I and GEN III.
EMAT Principle
The conventional ultrasound generation technique utilizes piezoelectric transducers in which ultrasound wave pulses are generated by a crystal element and fed into the pipe wall via a coupling liquid. In contrast, Electro Magnetic Acoustic Transducers (EMAT) are dry-coupled. For transmission into the pipe wall, an alternating current in a wire induces an eddy current in the metal surface. When this is combined with a static magnetic field, a force is produced which causes the steel metal grid to oscillate, thus launching a guided ultrasonic sound wave in the pipe wall.
Breaks in the homogeneity of this metal grid (i.e. defects such as cracks) will result in reflections of the sound wave. These reflected waves encountering the magnetic field will generate an eddy current, which in turn, induces a current in the wire. This current forms the received signal, which can be further processed and analyzed. The signal’s characteristics and its time of receipt, when combined with the signals of other sensors, provide accurate information about the feature’s size, depth and location. The following are key requirements for EMAT sensor operation and issues that present challenges to the implementation:
- A magnetic field must be applied in the steel,
- The transducer coil must be very close (approximately 1 mm) to the surface of the steel plate during the inspection, and
- The receiver must be extremely sensitive.
By mounting sensors on a sensor carrier, oriented circumferentially to the pipeline axis, the emitted sound waves travel circumferentially in the pipe. In contrast to ultrasonic crack detection tools which generate 45° vertical shear waves, the EMAT tool uses guided waves (e.g., horizontal shear waves and Raleigh waves).
Data Analysis
The data analysis process of the EMAT tool has gone through a period of change. The evolution is not just in the method of reliably determining the presence of reflectors and/or observing the coating condition of gas pipelines, but more importantly, an approach in evaluating various data sources to assist in continuous analysis quality improvements. This evolution has included incorporation of numerous excavation results in the last half decade of the EMAT tool operational application. The excavations are a key information source to benchmark the performance and increase confidence in the feature classification.
Longitudinal weld cracks are subject to complex reflection signal characteristics caused by partly concurrent signals from the weld and the crack. The long-range technique of the EMAT tool provides multiple bi-directional circumferential inspection of such areas while the overall detection redundancy compensates sensor lift-off caused by sensor traveling on the weld. In addition, a normalization of reflection amplitudes by a signal attenuation mapping process enables the differentiation of normal seam weld vs. crack reflections. Even weld geometry indications, which can be caused by the grinding off the seam weld at the girth weld area, are discriminated from injurious features.
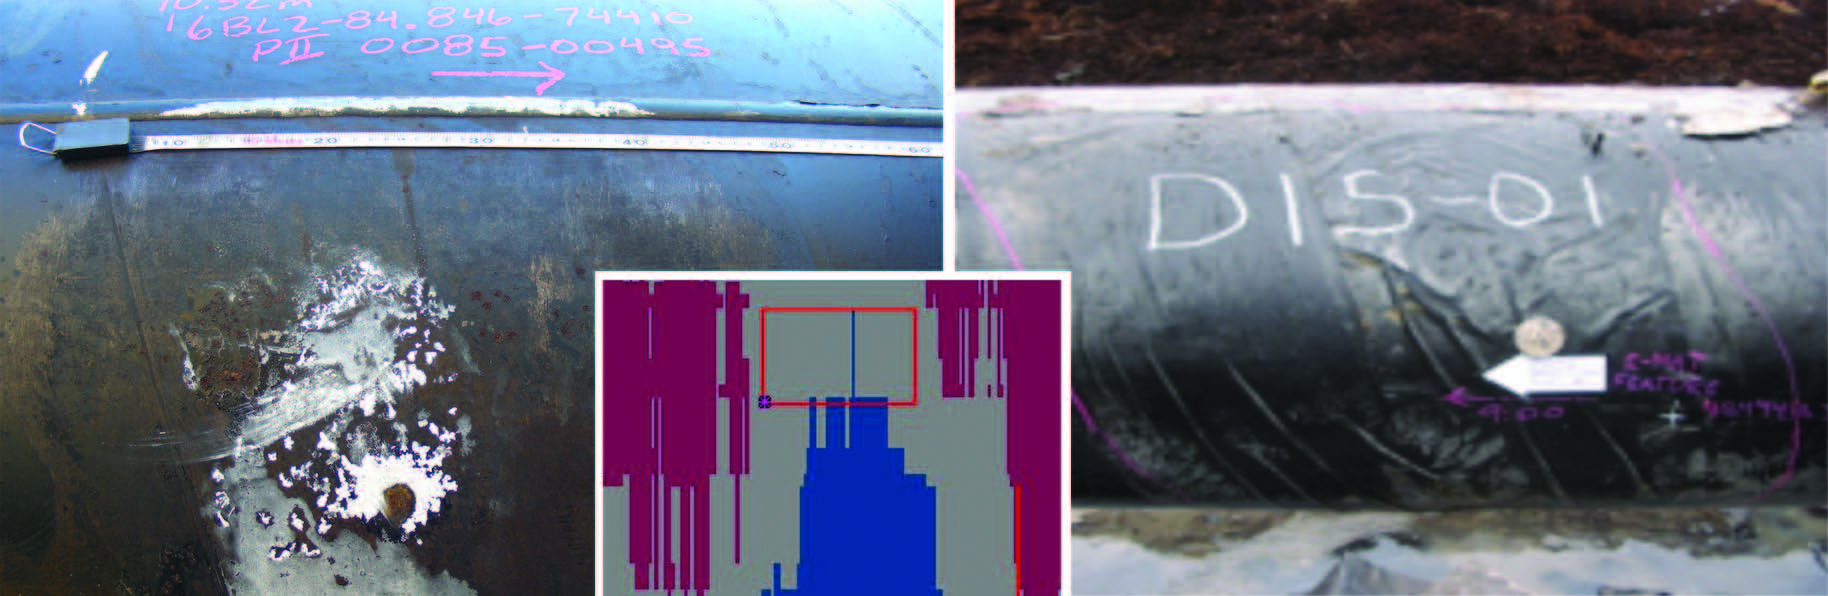
Those most recent enhancements have been elaborated in cooperation with Spectra Energy. During work that equaled an approximate 700-km inspection distance using the EMAT 36-inch tool in Spectra gas transmission systems, a total of 15 toe cracks were successfully verified. Figure 1 shows an example.

Figure 1: (top)Verified SCC at seam weld; (bottom) example of grind off.
Although the experience with the original EMAT 36-inch tool determined that the technology delivered the target specification, the results were limited to light and uncoated pipe.
Also identified was the influence of coating type and thickness, adherence of the coating to the pipe wall and the soil cover on the attenuation of the EMAT signal as it traveled through the pipe wall. A positive side to this discovery was the advancement of analysis tools to display changes in signal attenuation in a C-Scan view. This gave analysts the ability to identify areas of coating disbondment. The generation III tool was tasked to provide advanced maps and better visualization to aid the analyst in this coating condition assessment and would need to meet its target inspection in all coating types.
Another operational challenge encountered in the initial inspection was high wear of sensor surfaces from girth welds and pipe surface due to the dry coupling environment. Extensive testing in the lab did not accurately simulate harsh wear conditions of a real pipeline. An improved wear material was implemented to extend the inspection range of the tool, but impacted the sensitivity of the sensor by introducing extra background noise into the pipe wall. Optimal wear material for both inspection range and sensor sensitivity would be a major requirement for the generation III tool.
A final area of enhancement for the tool came from the results of the 207 field verifications completed from the EMAT 36-inch tool. The analysts would need more information from the tool to tighten confidence limits on making feature classifications.
The key to probability of detection (POD) is signal-to-noise ratio which – when maximized – allows for the processing of the key reflected signal while ignoring the background noise. Several factors play in determining signal to noise ratio. The first is the strength of the reflected signal compared to background. Since pipe coating has an attenuating effect on the signal as it travels in the pipe wall, sensor spacing in the circumferential direction was considered. Here, a trade-off is required. The closer the receiver is to the reflector, the stronger the return signal will be. Therefore, this closeness dictates an increase in the number of sensors arranged on the circumference.
An opposing phenomenon – the entire signal is not reflected by a feature – allows the un-reflected portion of the wave to travel farther through the pipe. This wave then affects the signal of neighboring sensors. This increased density has diminishing returns because increasing noise is detected from other sensors or an overly complicated firing sequence must be devised to limit noise from neighboring sensors.
Long-Range Inspection
A series of Design of Experiment (DOE) tests were conducted, and the optimal sensor spacing was selected that ensures significant and adequate signal strength, yet limiting extraneous noise from surrounding sensors.
Figure 2 shows B-scan data from a helical array of defects 1 mm deep and 50 mm long, spaced 30 mm circumferentially. The pipe was bitumen-coated. The data is from a clockwise and a counter clockwise firing sensor. From the number of notches detected, the optimal sensor spacing can be determined based on receiver listening window.

Figure 2: B-scans for a clockwise and a counter clockwise firing sensor from a helical array of 1 mm deep x 50 mm long defects.
The long-range inspection concept, as already applied on the generation I/II EMAT tool, was revalidated and found to be the optimum. The 36-inch sensor concept is based on a three-sensor arm design per carrier staggered on a total of four carriers. With the generation III design an additional sensor arm per carrier is added and the number of total carriers increased by 50% to a total of six for increased sensor types and coverage leading to more confidence and redundancy.
Wave Mode Selection
A second key to probability of detection is the selection of the optimum shear horizontal wave mode. Non-purity of wave mode excitation causes significant challenges for:
- A proper firing sequence selection in order to achieve non-desired signal crosstalk,
- Enhanced data interpretation to distinguish between real reflections and “ghost signals,”
- Redundant detection capability due to mode interference causing deconstructive local signal cancellation.
The sensor design performance tests were subject to various wall thicknesses, coating types, tool velocity and defect sizes in the pipe base material and seam weld region.
Data was collected from these by pulling through a fully assembled sensor carrier, including the operational electronics.
Figure 3 shows a typical defect set that is used for developing a depth-sizing model. The defects are all the same length (50 mm) and have depths (from left to right) of 5 mm, 4 mm, 3 mm 2.5 mm, 2 mm 1.5 mm, 1 mm and 0.5 mm. The pipe is tape-coated. The image shows the B-scan for all the sensors that have detected this defect set, consisting of eight in total. The 1 mm x 50 mm deep notch is detected by all sensors, and the 0.5 mm x 50 mm is detected when it is at close range.

Figure 3: B-scan images for all sensors detecting the “depth-sizing” set of notches in tape-coated pipe.
For certain combinations of coating types and pipeline environments, stress corrosion cracking (SCC) principally occurs in the toe of the long seam or immediately adjacent to it. For this reason, it was essential that the same detection performance could be achieved in this region as for the pipe body. Figure 4 shows data collected from a depth-sizing set (all defects 50 mm long and depths from 0.5 mm to 5.0 mm) where the notches are machined in the toe of the seam weld. The pipe was bitumen-coated which is considered a “worst-case” heavy attenuation coating for ultrasonic inspection purpose.

Figure 4: B-scans for depth sizing set in seam weld in bitumen-coated pipe.
POI is affected by the selection of the sensor type. Sound waves are often depicted in A-Scans as simple peaks. A study of sensor types demonstrated that different sensor types generate complex and unique wave forms which react differently to the same feature in the pipe wall. Evaluating the unique reactions of these sensor types forms the basis for a critical transfer function which describes a feature type in a very exact manner. Having at its disposal pipe spools from earlier EMAT 36-inch inspections, which contained both injurious and non-injurious features, GE could confirm the transfer functions with results that extend beyond the standard machined defects often used in prototype work.
Figure 5 shows the results of data collected from excavated pipe, which contains both SCC and laminations. Note the very clear segregation between the two feature types. This clarity provides the analyst with crucial information, removing any doubt in a classification. The benefit to a pipeline operator is fewer misclassifications and more consistency between analysts, plus further automated analysis techniques for classification allowing reductions in analysis cycle time. The calculation of the probability of identification (POI) for this data set when normalized to reflect a similar population of features represented by the 217 verified field features equates to a most probabilistic value of POI=81%.

Figure 5: Discrimination of pipeline anomalies achieved via sensor signal processing.
The classification of features is not only limited to reflected signals. Moreover, the assessment of transmission signals allows distinguishing between cracks and lamination. Figure 6 shows on the left an SH signal transmission map indicating the presence of a SCC. On the right, the same spools arrangement inspected with a discrimination sensor. In addition to the SCC, a lamination is detected.

Figure 6: Discrimination with SH and discrimination sensor.
Reliability
Many challenges exist inside the pipeline so redundant systems have to be in place to overcome any unforeseen issues. On the new 30-inch EMAT tool, additional redundant sensors of each type have been placed on the tool. As mentioned earlier, increasing sensor density increases background noise, so the additional sensors have been packaged in duplicate sensor carriers and spaced outside the interference distance. The increased quantity and pipe wall coverage of sensors not only compensates for sensors that may be damaged during an inspection, but also provides redundant feature signal information, which improves the confidence of the feature existence, classification, sizing, and location. The additional benefit is higher overall run reliability with a greatly reduced chance that a rerun will be required.
Each sensor carrier is equipped with drive electronics, signal processing instrumentation, auxiliary vehicle-positioning sensors and data storage. The pressure vessel and suspension systems have been designed to allow passage of large, unbarred T sections and negotiation of 1.5D bends.
The final major area of reliability improvement is in sensor endurance, primarily through wear-plate selection. Canvassing the metallurgical experts at the GE Global Research Center, the project team selected three potential materials candidates. After extensive lab tests failed to rule out any candidates, a live test in a 100-km pipeline was conducted. All three materials proved successful in the wear trial, meeting the wear tolerance specified for the test. This outcome allowed the team to pick the material based on impact to SNR rather than wear characteristics.
Speed
All POI and POD testing has been carried out via pull tests where the target speed has been achieved. The results, which have been demonstrated in earlier sections, confirm that the tool can operate in the range of 0-2.5 m/s. The benefit for a pipeline operator is the shorter period of time in which normal operations are disrupted.
Additional Enhancements
The tool has been built with modularity in mind. The design requirements anticipate situations where shorter tools are required due to the launch/receive infrastructure of pipelines. Tool length can be easily adjusted depending on the customer’s emphasis on tool length and redundancy requirements.
SCC is a main threat to the pipeline integrity of many gas pipelines. But waiting to find SCC may not be soon enough to efficiently manage the pipeline’s integrity. Therefore, it is important to provide information on factors that can lead to SCC formation. One such factor is coating disbondment.

Figure 7: Signal transmitted by one sensor received by remote sensor.
As mentioned earlier, sound waves pass through the pipe wall. The term transmission signal is used to describe the signal that is transmitted by one sensor and received by another remote sensor as illustrated in Figure 7. The external coating plays a major role in attenuating the signal as it transmits through the wall.
Transmitted signals are attenuated differently depending on the coating type. An area where the coating is less tightly bonded has a lower attenuation effect on the signal. Comparison of transmission signal amplitudes from various signals allows for the calculation of an attenuation map corresponding to the pipe surface. Changes in attenuation indicate differences in bond integrity of the pipe coating. An example of an attenuation map correlation with disbanded tape coating is displayed in Figure 8.

Figure 8: Correlation of Attenuation Map (left photo) missing primer and (right photo) wrinkled coating of pipe prior to removal.
Improvements to the generation III EMAT have enabled a high-resolution attenuation map of the pipe surface to be constructed with the attenuation map being synonymous with a map of the coating condition. Advanced algorithms have been devised to combine this data, eliminating channel-to-channel variation and correcting for the presence of the long seam. Figures 9 and 10 show coating holidays introduced into a Polyken®-coated test spool and the attenuation map from this test spool.
[inline:aFigure9.png]

Figure 9: Schematic (top) showing location and size of coating holidays in test pipe and attenuation map (below) showing detection of these coating holidays.
Conclusions
Meeting the harsh environment inside an operator’s pipeline is a challenging undertaking. Only through a rigorous and methodical approach is it possible to deliver an inspection vehicle that will successfully manage all the challenges.
The benefit to gas operators is true crack management without the need of a liquid batch or hydro test. EMAT inspection technology for pipelines is ideally suited to the detection of SCC colonies; sub-critical SCC; longitudinal-oriented fatigue cracks, toe cracks; cracks in or adjacent to the long seam weld; lack-of-fusion cracks; and coating disbondment.
Acknowledgement
This article is based on a presentation at the 2008 International Pipeline Conference held in Calgary, Alberta, Canada. The EMAT development has been a global effort with the project managed by the Ultrasonics Center of Excellence based in Stutensee, Germany, with expertise from its Sensors Group based in Cramlington, UK, sensor designers from GE Sensing in Alzenau, Germany, scientists from the GE Global Research Center (GRC) in Schenectady, NY and developers from the Forschungs-Zentrum in Karlsruhe, Germany also making significant contributions.
Bibliography
Yeomans, M., Ashworth, B., Strohmeier, U., Hugger, A., Wolf, T., “Development of 36” EmatScan™ Crack Detection (CD) Tool” International Pipeline Conference 2002, Calgary.
Kothari, M., Tappert, S., Strohmeier, U., Larios, J., Ronsky, D., “Validation of Emat In-Line Inspection Technology for SCC Management,” International Pipeline Conference 2004, Calgary

Comments