April 2009 Vol. 236 No. 4
Features
Billions Needed To Meet Long-Term Natural Gas Infrastructure Supply, Demands

Projected growth in North American natural gas supplies and market growth in the U.S. and Canada will require billions of dollars of additional investment in pipeline, storage and other midstream infrastructure through 2030, according to a new study released by the Interstate Natural Gas Association of America (INGAA) Foundation Inc.
The Natural Gas Pipeline and Storage Infrastructure Projections Through 2030 study, prepared for INGAA by ICF International, analyzes future natural gas infrastructure requirements under various market scenarios anticipates a range of investment in infrastructure over the next 20 years, primarily to attach increased domestic natural gas production from unconventional shale basins and tight sands to the existing pipeline network. Anticipated market growth from the electric generation and industrial sectors as well as the potential to connect vast Arctic resources and LNG supplies to the grid also will be key drivers for additional investment, according to the study.
“The domestic supply picture for natural gas has been redrawn and experts agree we now have more than 100 years of technically recoverable gas in the U.S. and Canada,” said Gary Sypolt, chairman of the INGAA Foundation. “This study spotlights what this sea of change in domestic supply will mean for investment in additional pipeline, storage and midstream infrastructure.”
In order to forecast natural gas pipeline and storage infrastructure projects through 2030, three different projections are presented in the report: a Base Case that represents an expected view of the future; a High Gas Growth Case in which markets and policies lead to greater growth in natural gas consumption; and Low Electric Growth Case in which future electricity sales grow at a relatively slower rate.
The scenarios presented have been produced by using ICF’s Gas Market Model (GMM), a widely used model for the North American natural gas market. Each scenario makes explicit assumptions about the future. The Base Case reflects an expected outcome for U.S. and Canadian natural gas markets by considering, and, in most cases, continuing recent market trends.
While the 100-page report also analyzes a wide range of the key drivers of natural gas infrastructure and U.S. and Canadian natural gas markets, the focus of this article is primarily limited to projected natural gas consumption, pipeline mileage requirements and expenditures through 2030 and the impact of the current recession.
$130 – $210 billion midstream expenditures
In the Midstream segment, the report forecasts that approximately $130 to $210 billion will need to be spent from 2009 to 2030 on midstream natural gas infrastructure in order to meet projected market requirements (Figure 1), equating to between $6 and $10 billion per year. Approximately 80 percent of necessary midstream infrastructure expenditures will be for natural gas transmission pipelines. Expenditures on new processing facilities will account for about 8 to 10 percent of the total investment on new midstream assets. Storage and LNG infrastructure, while important for efficient market operations, are projected to account for a relatively small portion of the total future investment needs. Current LNG terminal import capacity is underutilized and can accommodate projected growth.
The largest projected midstream infrastructure expenditures are expected to occur in the regions with the greatest projected growth in gas production. Shifts in natural gas supply sources are projected to be the main driver of midstream investments and not natural gas consumption growth. Canadian and Arctic expenditures are projected to represent 30 to 40 percent of future U.S. and Canadian expenditures. Most of the expenditures in these areas are related to the Alaska and Mackenzie Valley Pipeline Projects. If the roughly $50 billion required to construct the Arctic pipelines is not spent, then the portion of total investment that occurs in these regions will be significantly lower.
Natural gas consumption
In the Base Case projection, annual natural gas consumption in the U.S. and Canada is projected to grow from about 26.8 Tcf in 2008 to 31.8 Tcf by 2030, which equates to total market growth of 18 percent, or an annual growth rate of 0.8 percent. The two alternate cases, High Gas Growth and Low Electric Load Growth, bracket reasonable ranges of future gas consumption.
About three-fourths of the market growth occurs in the power sector, according to the report. The growth rate of natural gas consumption in the electric generation sector is the predominant determinant of the growth rate of the entire natural gas market. Electric load growth, timing and development of renewable generation technologies, clean coal with carbon capture and sequestration and expansion of nuclear generation are areas of uncertainty identified in the report.
Transmission pipeline mileage
In total, the study find that U.S. and Canada will need 28,900 to 61,600 miles of additional natural gas pipelines through 2030 (Figure 2). New infrastructure is needed throughout the U.S. and Canada and not just to move natural gas across long distances between regions. All regions will need natural gas infrastructure to serve growing demand and/or shifts in demand. Even regions with mature producing basins will continuously need some additional development. Since shifts in supply from traditional to unconventional sources have been, and are projected to continue to be the key driver of pipeline construction, regions with growing unconventional production will experience a higher proportion of infrastructure development. Thus, the Southwest and Central regions account for approximately 45 percent of projected incremental pipeline mileage added in all three cases.
The same two regions account for only 23 percent of projected consumption growth in the Base Case and High Gas Growth Case. The Western and Northeast regions that are predominately consuming regions, account for only 13 to 15 percent of projected incremental pipeline construction through 2030, even though they account for a larger portion of consumption growth in the Base Case and High Gas Growth Case.
Changes in pipeline capacity
In all three cases, interregional pipeline infrastructure development projected from 2010 through 2014 is based on announced pipeline projects, factoring in ICF’s assessments of each project’s viability. Longer-term pipeline capacity in each case has been assumed to be built within a year or so after basis differentials justify construction.
According to the report, much of the projected pipeline capacity is related to specific projects that are expected to be in service before 2012. These projects include pipeline capacity to connect Mid-continent gas production from shales, to connect LNG import terminals along the Gulf and East Coasts, to increase export capacity out of the Rockies, and to increase import capacity into Florida These projects, as well as others, will require roughly 3,000 miles per year of new pipeline between 2009 and 2012 (Figure 3).

The pace of long-haul interregional pipeline capacity construction is projected to slow after 2012. Much of the recently constructed and currently planned pipeline capacity is related to major shifts from traditional to unconventional basins.
A significant amount of pipeline capacity has been, or will soon be built to move natural gas out of the Mid-continent and the Northern Rockies, both to the east and the west. After 2012, most of the incremental long-haul interregional pipeline capacity developed will be related to Arctic projects. A relatively small amount of additional pipeline capacity is expected to be built out of the Rockies. Some incremental capacity will be needed into Florida.
Beyond 2012, excluding years with Arctic projects, between 1,000 and 1,500 miles of new transmission pipeline will be needed in order to serve U.S. and Canadian natural gas consumption needs through 2030. About one-half of this will be for transmission laterals that connect production, storage, power plants, and isolated demand areas. The remaining half will be split between new greenfield projects and expansions of existing pipelines.
Mainline gathering requirements
In the report, future mainline gathering requirements will be driven by the need to connect new production to the transmission system. In order to obtain annual production rates of 27 to 35 Tcf by 2030, between 15,000 and 26,000 miles of new gathering mainlines will be needed from 2009 to 2030 (Figure 4). New gathering lines are expected to be needed even in mature basins to replace retired lines or to hook up new natural gas wells. Projected incremental gathering pipeline mileage by region is based on historical mileage of gathering pipeline as a function of projected drilling activity and natural gas well completions. The Southwest region is the center of significant shale gas production development, and is expected to be the region with the most new gathering pipeline miles. Relative to the onshore, more gathering pipeline is needed to connect offshore production, because the vast majority of supply must reach the onshore before it can be processed. Consequently, significant amounts of gathering pipeline are projected for the offshore even though it is not a high production growth area.
U.S. Gathering Pipeline Mileage by Diameter, 2007
Pipeline Diameter Offshore Onshore Total
4 inches or less 157 4,422 4,579
4 to 10 inches 1,020 5,690 6,711
11 to 20 inches 4,533 1,803 6,336
21 to 28 inches 822 296 1,118
Over 28 inches 563 207 770
Total 7,095 12,475 19,570
Average Diameter 16 7
Source: U.S. Transportation Safety Administration
Infrastructure costs
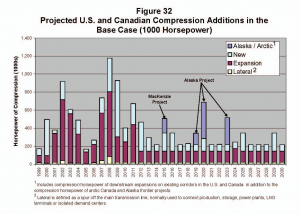
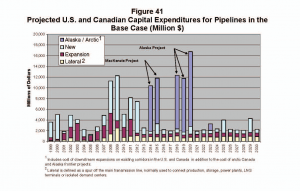
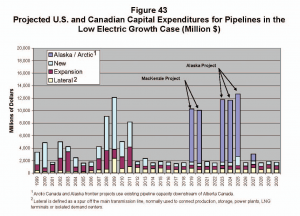
The report’s Base Case and High Gas Growth Case projects that $130 to $160 billion will be needed for new pipeline infrastructure development from 2009 to 2030. Even in the Low Electric Growth Case, which has much lower natural gas consumption, $108 billion is required in pipeline investments mainly to accommodate major shifts in the location of natural gas supply. Average annual expenditures for pipeline and compression infrastructure average approximately $5.9, $7.5, and $5.1 billion per year for the Base Case, High Gas Growth Case, and Low Electric Growth Case, respectively. In all three cases, projected expenditures exceed the $4.1 billion per year average from 1999 to 2008 (Figure 5, Figure 6, and Figure 7). Expenditures are expected to be greater even though the amount of incremental pipeline mileage needed is lower, due to the cost of the Arctic projects and general construction cost escalation.

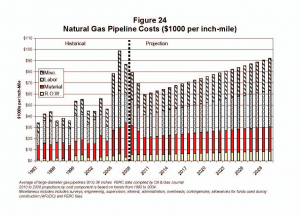
Gas pipeline cost per inch-mile
The cost of building natural gas pipeline(1) infrastructure varied between $30,000 and $100,000 per inch-mile(2) from 1993 to 2007 (Figure 8), according to the study. Through 2004, increases in pipeline construction costs were generally modest. After 2004, however, costs began to escalate dramatically, nearly doubling previous levels by 2006. This was due, in part, to high world commodity prices, especially the price of steel. Costs have declined recently and the several year cost run-up is expected to only be temporary. Since all three cases have similar GDP assumptions, input costs are assumed to be the same in all cases. Construction costs are projected to decline through 2010. After 2010, costs resume a general upward pattern consistent with the pre-2004 cost trends, which are slightly less than the assumed future inflation rate of 2.5 percent per year.
The study finds the cost of pipeline construction is divided roughly equally between materials, labor and miscellaneous. In 2007, materials costs accounted for over 35 percent of total costs, but have since declined. The miscellaneous category includes engineering, surveying, administration, and environmental costs. Costs for right-of-way account for 8 to 9 percent of total construction costs. This component has recently increased at a slightly faster rate than the other components. It is projected that the labor and right-of-way components will grow slightly faster than the other components, as skilled labor remains a premium commodity and pipeline permitting and siting continue to increase in complexity. The cost of materials is projected to increase at a rate slightly less than inflation and account for about 25 percent of total pipeline construction costs by 2030.
In all cases, cumulative transmission pipeline expenditures are similar through 2012, but they diverge thereafter. Considering the time required for pipeline planning, permitting and construction, it will take a few years before policy shifts such as those assumed in the High Gas Growth Case and the Low Electric Growth Case affect natural gas infrastructure investment. Pre-2012 pipeline infrastructure projects are already in advanced planning or already under construction, so they are not likely to be affected much by policy changes.
Recession impact
In the report, both the Base Case and the High Gas Growth Case assume that the U.S. and Canada are out of the current recession by the beginning of 2010. A shorter recession would have little impact on the projected amounts of midstream infrastructure developed. If economic growth resumes a few months earlier, the results would be only slightly different. All other factors being held equal, natural gas consumption and prices would rise more quickly due to the increased economic activity. Still, the change would most likely be unnoticeable. Current pipeline and storage projects most likely would not be impacted much, and future infrastructure projects beyond 2012 may be put in place six months to a year earlier.
If the recession were slightly longer, the impacts would be the reverse. Natural gas consumption and prices would tend to be lower than projected. A severely prolonged recession could, however, be problematic. Unconventional production has a relatively high decline rate. Drilling programs need to be continued in order to maintain production. Natural gas infrastructure will still need to be built to accommodate the locational shift in natural gas supply sources even if total U.S. and Canadian natural gas consumption is level or even declining.
The report warns, however, that a severe recession could limit the capital available for upstream and midstream investments necessary for the natural gas value chain to respond efficiently to demand. The credit quality of pipeline shippers might be impaired, creating another potential hurdle to proceeding with future pipeline projects.
The report also points out that many issues loom, particularly uncertainties regarding the direction of energy and environmental policies, and whether those policies will promote or discourage natural gas use.
Editor’s Note: The complete study prepared for the INGAA Foundation by ICF International can be accessed at http://www.ingaa.org/cms/31/7306/7828.aspx
Reference:
(1) Pipeline only, excluding compression.
(2) To provide clarity, a 24-inch diameter pipeline at a cost of $100,000 per inch-mile would cost $2,400,000 per mile.

Comments