
August 2020, Vol. 247, No. 8
Features
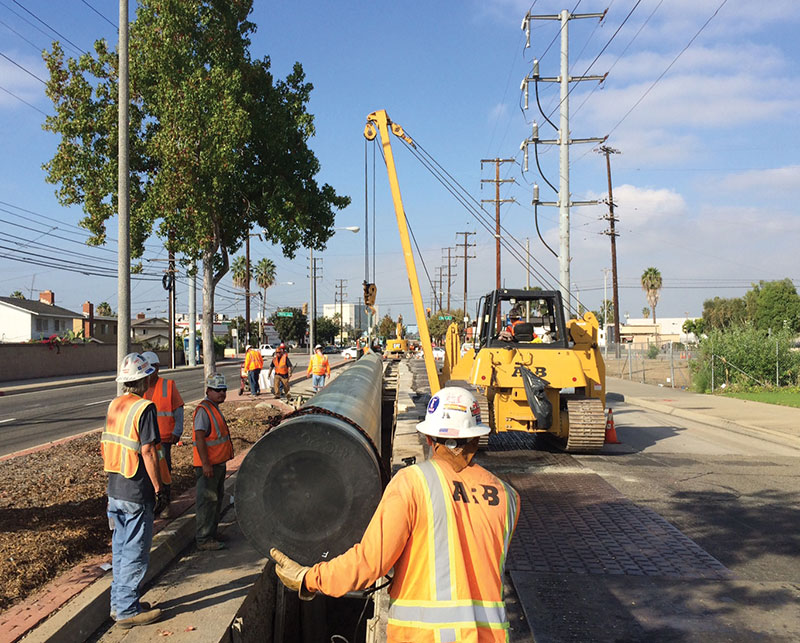
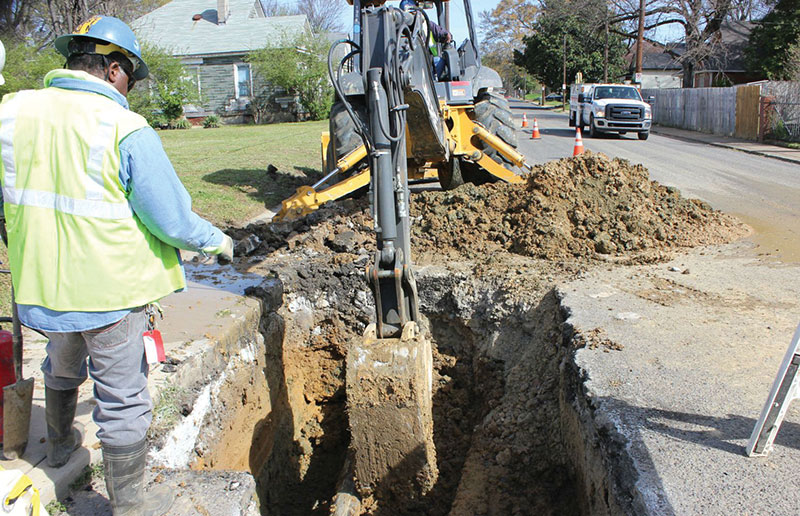
Replacing Aging Pipe Remains a Big Source for Work
By Michael Reed, Editor-in-Chief
With so many companies involved in natural gas distribution (P&GJ reports on more than 300 such companies, ranging in size from 6 million to a few hundred customers in the Annual 500 Report in November), this summary of ongoing infrastructure replacement projects is not an all-inclusive overview of activity.
The American Gas Association (AGA) stated in its 2017 Playbook that in the previous 10 years local distribution companies, or natural gas distribution companies, installed updated plastic pipelines at a rate exceeding 30,000 miles (48,000 km) per year. Additionally, the AGA data showed that of the more than $21 billion spent for gas utilities on construction, $11.6 billion or about 55% went for upgrading assets at the time.
While the amount of work still to be done to replace cast-iron and bare-steel pipe has declined in volume, since the implementation of the Gas Distribution Integrity Management Program (DIMP) in 2009, there are still plenty of construction left.
The federal Department of Transportation (DOT) estimated that at the end of 2019, 21,771 miles (35,000 km) of cast-iron and wrought-iron pipe lines were still in service in the United States. The majority of that is in older eastern cities, such as New York, Boston, Washington, D.C., and Philadelphia. This represents quite a headway since 2015, when there were 26,342 miles (42,393 km) still in the ground.
Among individual states, New Jersey led the way with 3,583 miles (5,766 km) of cast-iron and wrought-iron pipe, or 10.2% of its total, followed by New York (2,947 miles, 6%), Massachusetts [2,809 miles (4,521 km), 12.9%], Pennsylvania [2,403 miles (3,867 km), 4.9%] and Michigan [2,224 miles (3,579 km), 3.7%].
Further DOT data indicate that replacement work, while progressing steadily for more than a decade now, is far from complete. In 2015, there were still 27,771 miles of wrought- and cast-iron gas distribution lines in service in the U.S., down from 39,342 miles since 2005, a decrease of almost 30%.
With that in mind, these summaries show there is still a large volume of work to be done for decades to come through multibillion-dollar infrastructure replacement programs, many now underway nationwide, with more destined to follow. Keep in mind that much of this work has faced delays due to the onset of coronavirus (COVID-19).
East
UGI Utilities spent $187.5 million in fiscal 2019 replacing mains and completing enhancement projects. The company, which has 600,000 customers primarily in eastern and central Pennsylvania, has 86% of its 12,000 miles (19,312 km) of pipeline already constructed of modern contemporary material. About 64 miles (103 km) of cast-iron and bare-steel mains are targeted for replacement in the coming year.
Washington Gas continues to replace 15,960 miles (25,685 km) of mains and over 234,530 gas services as part of its accelerated pipeline-replacement program in Virginia, Md., and the District of Columbia. The work, depending on the location, will last another 12 to 35 years.
The majority of the work will occur in the District of Columbia, with most of the replacement pipe being medium-density polyethylene, most of 2-inch (51-mm) pipe or smaller.
Baltimore Gas & Electric (BGE) replaced about 40 miles (64 km) of gas mains in 2019 and plans to complete a similar amount of replacements this year. BGE accelerated the pace of replacement following passage of Maryland’s STRIDE law in 2013 and the Maryland Public Service Commission’s approval of BGE’s accelerated plan in March 2014.
STRIDE allows gas utilities to recover some of the costs of pipeline modernization as work is being done, making it possible to replace more aging infrastructure sooner.
PSE&G, which has more cast-iron pipes in its system than any other utility in the nation, is still at work. Of the system’s 18,000 miles (28,968 km), about 3,600 miles (5,794 km) of mains remain cast-iron, according to company records. The company expects to replace up to 875 miles (1,408 km) of pipe through 2023, with the rest of effort likely to last up to 25 years.
Con Edison continues to replace, on average, 65 miles (105 km) of cast-iron and unprotected steel gas mains each year and looks to continue at that rate for at least another 20 years.
The company maintains about 4,000 miles (6,437 km) of gas mains and service lines in Manhattan, the Bronx, and portions of Queens and Westchester County, a little less than half of which are targeted for replacement.
National Grid’s effort could last for 20 years as the company removes pipe, some of it dating back to the 1800s, and replaces it with high-density plastic pipe. About 1,000 feet (305 meters) of pipeline can be replaced in four or five days, the company has said, with directional drilling frequently used to install pipe beneath sidewalks and roads.
In Boston, National Grid expects to replace the nearly 400 miles (644 km) of the remaining cast-iron, wrought-iron and unclad steel pipe in that system over the next 20 years. The company is also boosting efforts in Rhode Island, which is one of the oldest systems in the nation. The state has about 690 miles (1,110 km) of cast-iron and bare-steel pipe in its system, which is 21.6% of its total.
PECO Energy, which serves close to 500,000 gas customers in southeastern Pennsylvania, about 90% of whom are residential, has steadily increased its main replacement pace since 2015, while boosting its rate of bare-steel service replacement from 1,800 to 4,000 services per year.
PECO is investing more than $60 million each year to replacement efforts and is working to relocate all indoor natural gas meters to the exterior of customer properties in compliance with a Pennsylvania Public Utility Commission requirement.
Midwest
Laclede Group’s three utilities in the St. Louis and Kansas City areas, and in Alabama, continue to schedule about 235 total miles (378 km) of pipe replacement a year.
In St. Louis, for Laclede Gas, the work largely occurs within the city and the inner ring of surrounding suburbs. Originally, many of the residential gas meters were installed inside basements, so the Laclede program includes moving about 328,084 feet (100,000 meters) outside of homes.
Detroit’s DTE Energy is halfway through its five-year, $2.5-billion gas and electric infrastructure upgrade in which it plans to spend $1.4 billion for natural gas pipeline infrastructure. The program will modernize cast-iron and steel main pipelines with more durable material, the company said. The plan also calls for new service lines and upgrades at compressor stations.
Integrys Energy continues its effort, which began in 2011, to remove about 2,000 miles (3,218 km) of cast-iron mains within its Peoples Gas Distribution system, largely within the greater- Chicago area. The company will also install 300,000 service pipes and meters.
Cast-iron pipes are being replaced with polyethylene plastic pipes, ranging from 2 to 18 inches (51 to 457 mm). Protected steel pipe, generally 24 inches but up to 42 inches (610 to 1,067 mm), are being installed as well.
Last Sept. 14, PUCO approved an expansion of the work and authorized an increase in the annual program investment. The ruling will allow Dominion to increase spending by up to an additional 3% in the years 2019 through 2021.
Over the 25-year program, Dominion will upgrade its system from bare-steel, cast-iron, wrought-iron and copper pipe to coated steel or plastic pipe. This will typically affect the main line, which is usually in the street, and various service lines, running from gas meters.
Vectren, with 570,000 customers, continues to replace gas mains and service lines in 15 cities across the service area in central and southern Indiana. This year Vectren plans to replace about 36 miles (58 km) of gas mains and 3,200 service lines in Dayton, Ohio.
The multiyear program targets 700 miles (1,127 km) of bare-steel and cast-iron pipe and is progressing at a pace that is replacing 55 miles (89 km) of pipe at a cost of $37 million per year. Most of the work will involve polyethylene infrastructure being used to replace pipe ranging from 2 to 8 inches (51 to 203 mm).
South
TECO Peoples Gas continues to replace its cast-iron and bare-steel distribution pipe in the Tampa, Fla., area under a program begun in 2012. The company has been replacing an average of 15 miles (24 km) of cast-iron and 40 miles of bare-steel pipe each year.
CenterPoint Energy has about 100 miles (161 km) of cast-iron and 408 miles (657 km) of bare-steel pipelines remaining in Louisiana, planning to remove more than 1,700 miles (2,736 km) of cast-iron pipes – 90% of its entire system – and 2,116 miles (3,405 km) of bare steel over the course of 30 years.
West
Spokane, Wash.-based Avista Utilities, which serves eastern Washington, northern Idaho, and portions of southern and eastern Oregon, as is common with newer systems in the West, has never had cast-iron in its system.
However, the company is maintaining a 20-year program to replace 700 miles (1,127 km) of plastic main piping and install transition tubing at about 16,000 steel tees. The overall project cost for replacing pre-1987 plastic pipe will cost about $20 million per year.
Pacific Gas and Electric Company (PG&E), which serves most of the northern two-thirds of California, replaced all known system-wide cast-iron pipeline ahead of its 2014 year-end goal. Since then, it has focused on eliminating all pre-1940 steel pipe, replacing about 30 miles (48 km) a year.
Gas Distribution Cast/Wrought Iron Pipelines
Year: 2019
State main % of total service % of total
miles main miles count service count
New Jersey 3,583 10.2% 0 0.0%
New York 2,947 6.0% 3,638 0.1%
Massachusetts 2,809 12.9% 1,344 0.1%
Pennsylvania 2,403 4.9% 73 0.0%
Michigan 2,224 3.7% 10 0.0%
Connecticut 1,173 14.2% 16 0.0%
Maryland 1,111 7.2% 23 0.0%
Illinois 1,107 1.8% 55 0.0%
Rhode island 690 21.6% 22 0.0%
Alabama 669 2.1% 214 0.0%
Missouri 630 2.2% 0 0.0%
District of Columbia 405 33.1% 0 0.0%
Texas 388 0.4% 0 0.0%
Nebraska 244 1.8% 2 0.0%
Ohio 174 0.3% 12 0.0%
Virginia 172 0.8% 75 0.0%
Louisiana 139 0.5% 945 0.1%
Indiana 110 0.3% 23 0.0%
New Hampshire 64 3.2% 12 0.0%
Delaware 56 1.7% 0 0.0%
California 56 0.1% 29 0.0%
Mississippi 32 0.2% 1 0.0%
Maine 30 2.2% 22 0.1%
Florida 23 0.1% 0 0.0%
West virginia 11 0.1% 23 0.0%
Kentucky 10 0.1% 92 0.0%
Tennessee 7 0.0% 4 0.0%
Kansas 4 0.0% 0 0.0%
Georgia 1 0.0% 0 0.0%
21,273 6,635

Comments