August 2017, Vol. 244, No. 8
Features
Natural Gas Trading Reported Second Highest in 9 Years
The amount of physical natural gas traded in the United States rose 5% in 2016 to the second-highest amount in nine years, according to a recent study by economic and financial consulting company Cornerstone Research.
Meanwhile, the natural gas fixed-price volume potentially reported to price-index publishers decreased 6%.
Among other findings from the Characteristics of U.S. Natural Gas Transactions study:
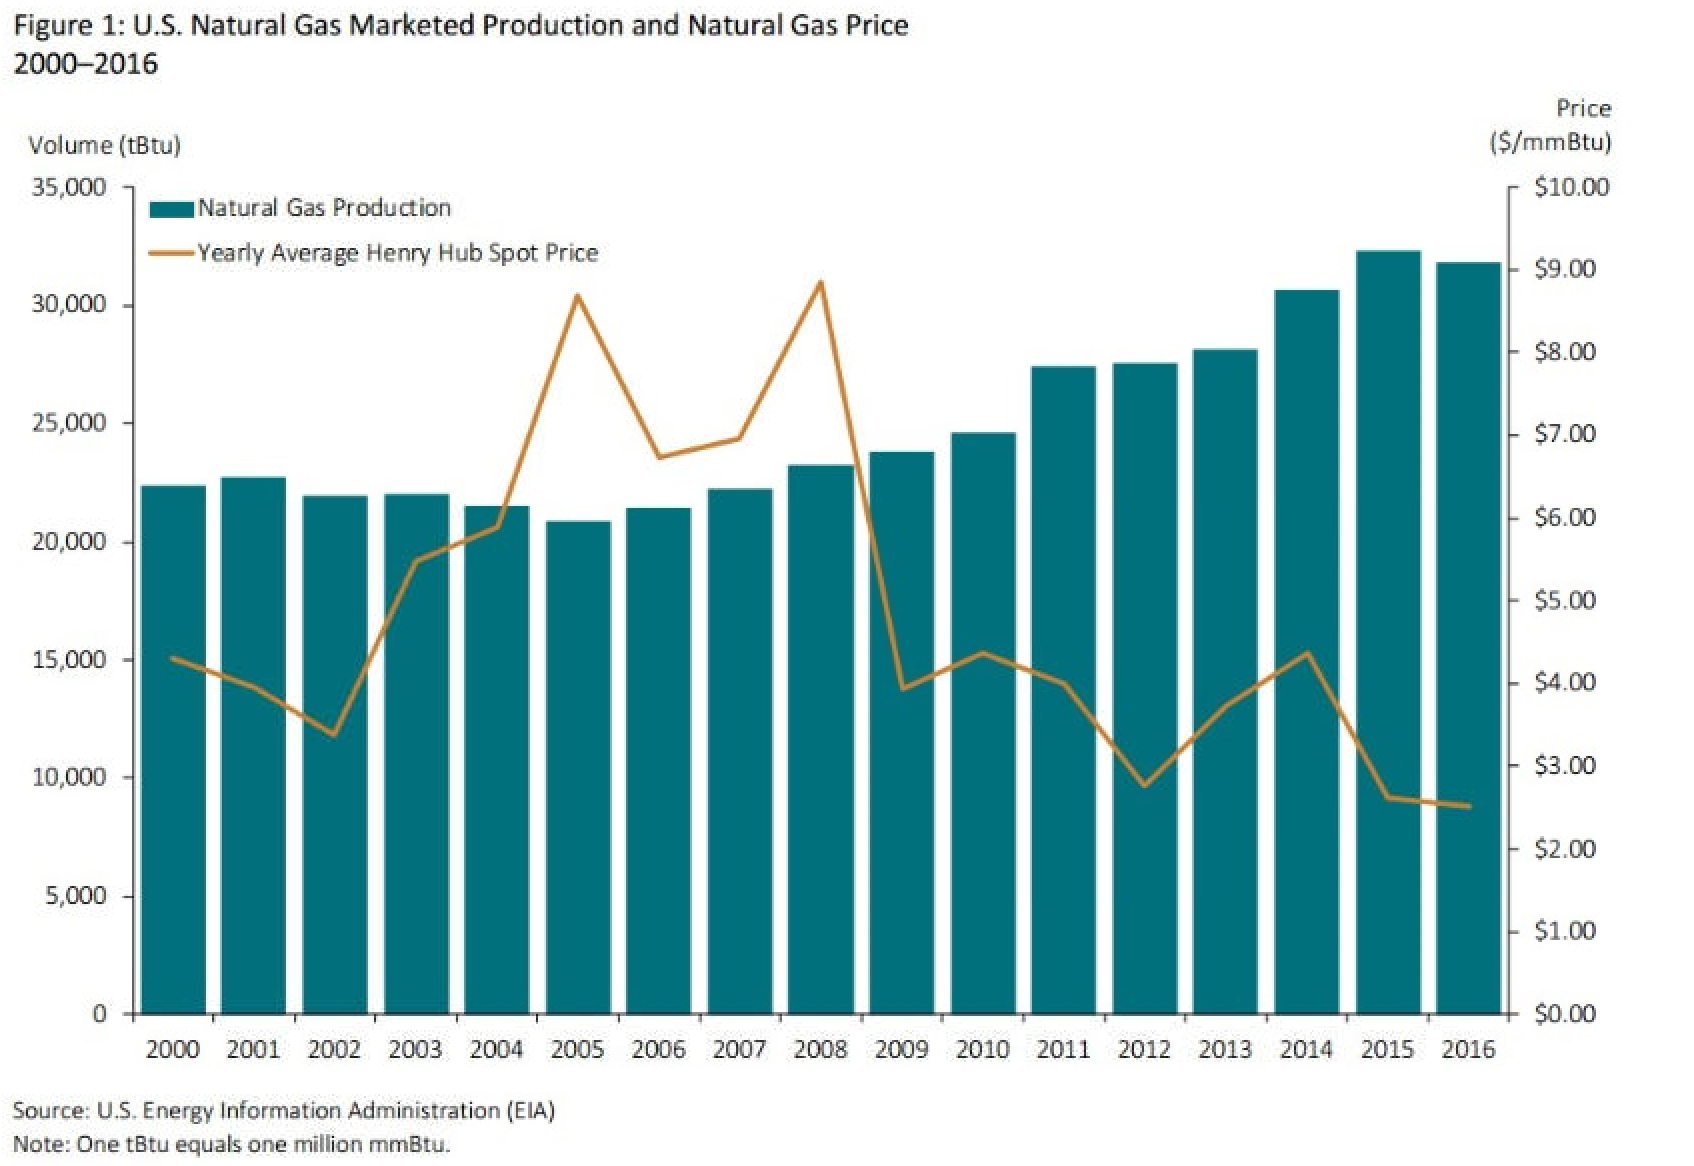
- Annual marketed production decreased by 1.6% in 2016, the first decrease since 2005. This was partly due to the decline in prices from an annual average of $2.62 in 2015 to $2.52 in 2016.
- Due to the Henry Hub spot price increase in the second half of 2016, the EIA expects this trend to continue through 2030, stabilizing at about $5 through 2040.
This was the second consecutive annual increase in U.S. natural gas trading. Production, however, experienced a modest decline. Volume on the two main futures exchanges also went in different directions – CME’s volume rose 17% while ICE’s declined 2.2%. In aggregate, trading of natural gas contracts on the two exchanges still showed an increase.
Last year was notable for new destinations for U.S. natural gas exports. The first shipment of liquefied natural gas (LNG) from the lower 48 states occurred early in the year. Also in 2016, the first LNG carrier passed through the new, larger set of Panama Canal locks, which provide a more direct route from the U.S. Gulf Coast to Asia. Europe remained a source of demand for U.S. natural gas, but is now facing competition from Asia.
“The EIA (Energy Information Administration) is forecasting that the United States will become a net exporter of natural gas by 2020, largely due to the expected expansion of the LNG market,” said Greg Leonard, a co-author of the report.
“While LNG made up less than 10% of total U.S. natural gas exports last year, the expected completion of additional LNG export facilities, the opening of the new, larger Panama Canal locks, and the implementation of more flexible LNG contracting practices are fueling this projected expansion,” he said.
The study found the 20 companies with the largest total transaction volumes indicate the United States has a large number of diverse participants. These companies tend to remain the same from year to year – 15 of the top 20 were back from the previous year’s list.
The top 20 companies accounted for 56,366 trillion Btu (TBtu), or about 43% of the volume reported on FERC Form 552 submissions in 2016. This share of volume is consistent with the previous three years, Cornerstone said.
BP Energy Company had the largest physical volumes for the ninth year in a row at 8,697 TBtu, a slight decrease from 8,772 TBtu from 2015. BP Energy’s volume was almost 75% more than that of the second-largest trader.
Other key findings:
- The trading activity reported in FERC Form 552 submissions totaled 130,012 TBtu transacted by 711 respondents.
- Of the 711 respondents, only 15% reported transaction information to the price-index publishers for themselves or at least one affiliate.
- For the second consecutive year, companies chose not to report more than half of the reportable fixed-price volume.
- Based on Cornerstone Research’s proprietary classifications of market participants, integrated-upstream firms and traders or wholesale marketers made 73% of the potentially reported fixed-price transactions.
- The top 20 companies accounted for about 43% of volume reported on Form 552 submissions.
- Based on trading activity, according to FERC Form 552 and futures exchanges, CME Group Inc. volumes rose for a second year in a row at 17%, while the Intercontinental Exchange volume declined 2.2%.
“One finding that we have been seeing for the last several years is that the ratio of fixed-price natural gas volume potentially reported to price-index publishers continues to decrease relative to the volume of index-priced natural gas,” said Nicole Moran, co-author and senior manager at Cornerstone.
“This tells us that the index-priced volume is dependent on a smaller base of fixed-price volume. In 2016, the ratio reached 8.6. In other words, each 8.6 molecules of index-priced natural gas were priced off one molecule of fixed-price gas reported to price-index publishers,” he said.
Despite a small decrease in natural gas production in 2016, the EIA projects production will grow about 4% annually through 2020. The increase is projected in part due to improved extraction technology and capital-intensive projects, such as liquefaction export terminals and petrochemical plants, the study said.
Production from shale gas and tight oil plays has increased substantially over the past five years, and the EIA predicts these sources will account for almost two-thirds of U.S. natural gas production by 2040. The United States is expected to become a net exporter by 2020, due largely to LNG market expansion, Cornerstone said

Comments