
December 2015 Vol. 242, No. 12
Features
NGSAs 2015-2016 Winter Outlook for Natural Gas
Strong natural gas production and storage inventories approaching a new record have positioned the nation’s gas industry well to meet winter demand, the Natural Gas Supply Association (NGSA) said in its 15th annual Winter Outlook assessment of the natural gas market.
The NGSA used data from the Energy Ventures Analysis (EVA) Report and the federal Energy Information Administration (EIA) for its demand and supply projections and IHS Economics (formerly HIS Global Insight), for its economic projections in the Winter Outlook. The NGSA analysis does not project actual price figures for wholesale or retail markets.
Using published data and independent analyses, NGSA evaluated the combined impact of weather, economic growth, customer demand, storage inventories and production activity on the direction of natural gas prices for the winter of 2015-2016 compared to last winter when Henry Hub prices averaged $3.21 per MMBtu.
“When NGSA weighed all the different factors, the picture that emerged for the upcoming winter is one of a flexible natural gas market that is able to respond to changes in weather and customer demand with abundant production and storage. We anticipate neutral pressure on prices compared to last winter,” said Bill Green, NGSA chairman and vice president, Downstream Marketing, for Devon Energy Corp.
He added, “The continued stability and abundant supply of natural gas is great news for consumers.”
Following is detailed information about each of the five factors analyzed in NGSA’s 2015-2016 Winter Outlook, as well as possible “wild card” factors and a discussion of natural gas industry trends that transcend this winter. Also included is a section on infrastructure events from the EVA Report that was used as a source for the Outlook.
Weather/Demand
Based on NOAA’s projections for warmer-than-average winter temperatures, EVA forecasts that the winter months will be 7% warmer than the winter of 2014-2015 – which was a relatively cold winter – on a national average, and 3% warmer than the 30-year average.
On a regional basis, NOAA’s forecast for a strong El Niño weather pattern cleanly divides the country into thirds. One large tier is projected to be warmer than average: this tier includes all of California, then stretches across the upper tier of the U.S. to Pennsylvania and points north.
A second tier shows normal winter temperatures projected across the center of the country from the Southwest to the Carolinas. And finally, a smaller southern tier is projected to be colder than normal, including Texas, Florida and a few bordering states.
As a nation, over the full five-month winter-heating season (November 2015-March 2016), EVA is forecasting 3,432 heating degree days (HDDs) this winter compared to 3,685 HDDs last winter. The number of heating degree days is defined as the difference between 65 degrees F and the average outside temperature for that day. Based on the difference in winter-over-winter heating degrees, the forecast is for weather to put downward pressure on natural gas prices.
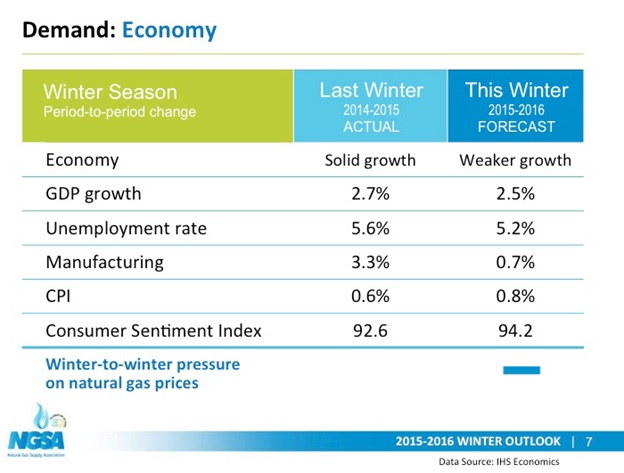
Economy/Demand
This winter, public forecasts anticipate an economy that will grow at a similar rate to last winter.
A key component of economic health is the Gross Domestic Product (GDP). According to IHS Economics, the GDP is expected to increase 2.5% compared to the winter of 2014-2015, when GDP expanded by 2.7%. The difference is not expected to be significant enough to exert pressure on prices.
IHS Economics also predicts that manufacturing, an important influence on the GDP, will only grow 0.7% in winter 2015-2016, a significant drop from last winter’s 3.3% growth. The decrease in manufacturing activity is attributed to global economic uncertainty and the relative strength of the dollar affecting international sales and creating an inventory overhang. Meanwhile, the latest Consumer Sentiment Index (CSI) indicates consumers feel very positive about the economy, with the CSI tracking at 94.2%, reflecting general consumer optimism, probably the result of a strong labor market (5% unemployment), low inflation and decreased energy prices.
The CSI is a gauge of consumer confidence in the economy conducted for over 40 years by the University of Michigan. While these economic indicators generally reflect good news for consumers, the changes are too small to pressure prices. Therefore, NGSA anticipates the economy will place level winter-over-winter pressure on natural gas prices.
Overall Natural Gas Demand
An independent demand analysis performed by EVA notes that natural gas demand will slightly decrease compared to last winter. EVA forecasts overall winter 2015-2016 demand for natural gas at 90.2 Bcf/d compared to 91.5 Bcf/d last winter. A sector-by-sector breakdown follows.
When analyzing the electric sector’s projected demand for natural gas this winter, EVA predicts a solid increase of 1.1 Bcf/d, despite the forecast for milder, warmer temperatures. The major cause of the increased demand from the electric sector can be attributed to a significant increase in coal-to-gas switching compared to the previous winter. Coal-to-gas switching, also known as fuel switching, occurs when electric utilities choose to run natural gas-fired power plants rather than coal plants to generate electricity. Switching is a short-term, temporary decision that is purely an economic choice based on the price of the competing fuels. The projected increase in fuel switching this winter is the result of the competitive price of natural gas.
EVA’s prediction for fuel switching to grow to a sizeable 5.8 Bcf/d of natural gas demand this winter – approaching the all-time record of 6 Bcf/d set in the winter of 2011-2012 – is all the more remarkable in light of the fact that, prior to the shale revolution, coal-to-gas switching had never lasted longer than a few days at a time. In contrast, switching has persisted for seven consecutive years since 2008.
A more long-term, structural shift in the electric sector accounts for the other source of increased demand for gas-fired generation this winter. As of April 2015, the electric industry must comply with EPA’s Mercury Air Toxics Standards (MAS) rule to reduce mercury emissions. EVA anticipates the retirement of 20 GW of coal-fired electricity for 2015 to be replaced by natural gas-fired generation. This is the first wave: an additional 24 GWs of coal plant retirements have been announced for the 2016-2020 timeframe.
Despite the projection for a significant decrease in manufacturing output, the industrial sector is expected to slightly increase its winter consumption of natural gas by 0.2 Bcf/d to 22.8 Bcf/d. Growth continues in the key natural gas-intensive petrochemical, fertilizer and steel sectors, which are moving forward on numerous facilities in the 2015-2020 timeframe. In line with the growth projected for this winter, EVA points out that an extended forward view of industrial demand shows 66 new and expanded major natural gas-intensive industrial projects occurring from 2015-2020, representing an investment of about $117 billion to build and an increase of 3.9 Bcf/d by 2020.
The industrial growth projected over the next five years is primarily due to the petrochemical, fertilizer and steel industries expanding to take advantage of affordable, abundant natural gas in the U.S. Most of these major projects are slated for southern states with the exception of some steel projects in midwestern states.
Roughly 75% of these manufacturing projects are brand-new projects and approximately 25% are expansions.
According to EVA, winter-over-winter demand from the residential and commercial sectors is expected to be 6% less than last winter, due to the forecast for milder weather and fewer HDDs.
When customer demand from the electric, industrial and residential/commercial sectors is combined, overall demand is very slightly less than last winter, but not enough to place pressure on prices. Overall customer demand is expected to place neutral pressure on prices this winter.
Storage/Supply
Traditionally, underground natural gas storage has allowed companies to purchase and physically stockpile natural gas supplies in the spring and summer for use during the winter when demand for natural gas space heating is at its peak.
Going into the winter-heating season, it is projected that approximately 3,950 Bcf of natural gas will be in storage – approaching a record-setting 4 Tcf and significantly more than the approximately 3,600 Bcf in storage at the same time last year. The difference is expected to place downward pressure on natural gas prices this winter.
Production/Supply
Turning to natural gas production, EIA expects domestic production to outperform last winter, despite a decrease in the number of drilling rigs and well completions compared to last winter. Domestic natural gas production this winter is forecasted to be 74.4 Bcf/d, slightly more than last winter’s 73 Bcf/d.
Among the reasons that winter production is expected to increase are: continued strong production from shale gas plays due to increased efficiencies in natural gas extraction techniques and improved takeaway capacity in the form of new pipelines and processing plants in areas such as the Marcellus.
The 2015-2016 Winter Outlook also predicts a moderately sized, but important, contribution from Canadian imports of 5.6 Bcf/d, as well as some LNG imports. However, these LNG imports will be offset by the first LNG exports beginning in late 2015 from the Sabine Pass terminal in Louisiana. Although more export facilities will follow over the next few years, the amount of LNG to be exported is projected to remain a small slice of overall demand.
Finally, EVA expects natural gas exports to Mexico in the range of 3.2 Bcf/d compared to 2.2 Bcf/d last winter, with the construction of new pipelines in Mexico and its growing economy. In summary, strong supply this winter will be similar to last winter’s, placing neutral pressure on natural gas prices compared to the winter of 2014-2015.
Infrastructure Events
Although not discussed in detail in the Outlook, data provided for the report by EVA also focused on infrastructure events.
As illustrated in chart above, slightly over 50% of the new pipeline projects for the 2013-2018 period are in the Northeast and designed primarily to accommodate significant increases in Marcellus and Utica shale production. With respect to the pipeline projects for the other regions, these include (1) pipelines to support new LNG projects; (2) pipelines to support increased exports to Mexico; and (3) other pipeline projects spread across the U.S.
During fourth quarter of 2015 EVA projects the likelihood of an infrastructure event similar to those for the last two winter seasons will occur. However, like the event in 2014, the forthcoming infrastructure event will be spread across the months of November and December, plus the first few days in January 2016 when the Constitution Pipeline (0.65 Bcf/d) comes online.
Mexican Pipeline Infrastructure
With respect to the expansion of Mexico’s pipeline infrastructure, EVA notes that historically there has been significant export capability from the U.S. to Mexico; however, inadequate takeaway capacity within Mexico has limited exports.
Mexico is in the process of relieving this bottleneck with the construction of new pipeline systems.
Noting the infrastructure expansion within Mexico can be divided into two phases, it identifies the first phase as involving the construction of three major pipeline systems within Mexico, namely the Northwest Pipeline 22 System, the Chihuahua Pipeline System and the Los Ramones Pipeline System, which have a total capacity of 4.8 Bcf/d. All these systems either are already online or will be online by early 2016.
With respect to the second phase of the expansion of gas pipeline capacity, Mexico recently authorized the following five systems:
• The Waha to San Elizario pipeline (1.35 Bcf/d; Jan 2017), which connects to the San Isidro-Samalayuca system
• The Waha to Presidilo pipeline (1.35 Bcf/d; 2017), which connects to the Ojinaga to El Encino pipeline noted below
• The El Encino pipeline (1.135 Bcf/d; July 2017)
• The El Encino to La Laguna pipeline (1.35 Bcf/d)
• Ramal Tula (0.485 Bcf/d)
These five systems, which will cost approximately $2.2 billion, will be completed in phases. In addition, Mexico will use the resulting imports to initially displace LNG imports at Altamira and eventually at Manzanillo.
Wild Card Market Factors
There are always a few “wild card” factors that can influence the market in addition to the fundamentals addressed in this Outlook. This winter’s wild cards include:
• Unexpected cold or warm snaps could affect residential/commercial demand and electric demand
• Global economy could affect industrial growth
• Regional pipeline constraints could have short-term impact on areas with tight capacity
In conclusion, NGSA analysis of varying data indicates overall flat pressure on natural gas prices this winter compared with last winter. For more information,visit www.ngsa.org or contact NGSA directly.
[inline:NGSA2.jpg]

Comments