
June 2015, Vol. 242, No. 6
Features
Developing Engineering-Based Integrity Programs for Pipelines, Plants
Integrity assessment has always been a part of operations and maintenance activities. As plant piping and pipeline infrastructure has aged, industry first developed basic tools, and as their importance became apparent, these tools improved to meet those increasing needs.
Then, as integrity questions were raised, assessment methods were developed for specific anomalies. Although energy-based integrity management program (EB-IMP) was developed primarily for the pipeline industry, its applicability to piping in refineries and plants is certainly appropriate, especially considering its foundation on API 579-1/ASME FFS-1.
The natural gas and liquid transmission pipeline industries have embraced the use of new technologies and have striven to implement improvements to ensure safe pipelines. There are several examples that can be cited to demonstrate this point. One example is pipeline corrosion. The industry first gathered wall thickness data using low-resolution metal loss magnetic flux leakage (MFL) inline inspection (ILI) tools.
The results from these tools were recovered via charts, and many man-hours were spent analyzing them, using tables based on conservative engineering and research results. The results from these analyses provided information on anomalies and indicated in what areas resources should be directed to conduct physical examinations of the pipeline.
As the performance of tools improved, using better sensors, data storage and analysis, the information quantity and quality available for analysis grew exponentially. Currently, data is pre-processed onboard the ILI tool, analyzed in detail by experts working for the tool supplier, and then provided to the pipeline company with software to further review the results for use in making decisions regarding pipeline integrity and remediation requirements.
Other integrity threats have followed similar paths over the years. For example, ILI technology used to find mechanical damage, selective-seam corrosion and cracking has improved significantly over time.
Refined Tools
In conjunction with ILI analyses, pipeline companies have used software applications, such as RSTRENG to make repair decisions for corrosion in straight pipe. While improvements have been made to RSTRENG, no developments have taken place to address corrosion in pipe fittings.
Similarly, other threats like mechanical damage and dents have been evaluated using prescriptive, one-size-fits-all solutions written into federal codes and industry pipeline standards, such as ASME 31.8. For example, the criteria used for decision-making regarding plain dents is the dent depth to pipe diameter ratio. These simplistic analysis methods do not consider dent profile details (i.e. curvature or sharpness of the dent), pipe properties or pipeline operating conditions.
While these generic analyses can generate information for making IMP decisions, they often result in recommending unnecessary repairs. The repairs are then made using simple but effective methods such as steel sleeves or replacement of the damaged pipe. In recent years steel sleeves have been supplemented with composite repair sleeves.
The proposed EB-IMP offers industry an alternative or improvements to conventional integrity management approaches. The EB-IMP is based in large part on the inclusion of full-scale testing, when appropriate, to reduce the potential uncertainties in numerical modeling and provide greater confidence for the operator in understanding what conditions can lead to failure of the pipeline.
By understanding failure modes, industry can select appropriate design margins to ensure safe operation, while not imposing overly burdensome safety margins that force operators to use unreasonably low pressure levels. Another important element of the EB-IMP is that it includes developing repair solutions to extend the useful life of pipelines with known imperfections.
EB-IMP Solution
API Recommended Practice 579, Fitness-For-Service, was developed for the refining and petrochemical industry in 2000 and takes advantage of improvements in inspection and analysis by providing a basic method for assessing “metallurgical conditions and analysis of local stresses and strains which can more precisely indicate whether operating equipment is fit for its intended service.”
These analyses address integrity concerns arising from historical design or fabrication imperfections or deterioration as a result of service conditions such as cracking or corrosion.
Two elements are not explicitly addressed in API-579. The first concerns the use of experimental methods or in situ measurement techniques to evaluate integrity. The other missing element concerns the development of repair techniques for the remediation of substandard equipment. It is recognized the former might be a challenge in plant environments (performing a full-scale burst test on a $2 million platform reactor is not practical).
However, full-scale testing is ideally suited for pipelines in which materials and anomalies can be evaluated apart from the pipeline system. In this regard, one purpose of the proposed EB-IMP solution is to analyze relevant test data and then develop cost-effective remediation methods to address integrity concerns.
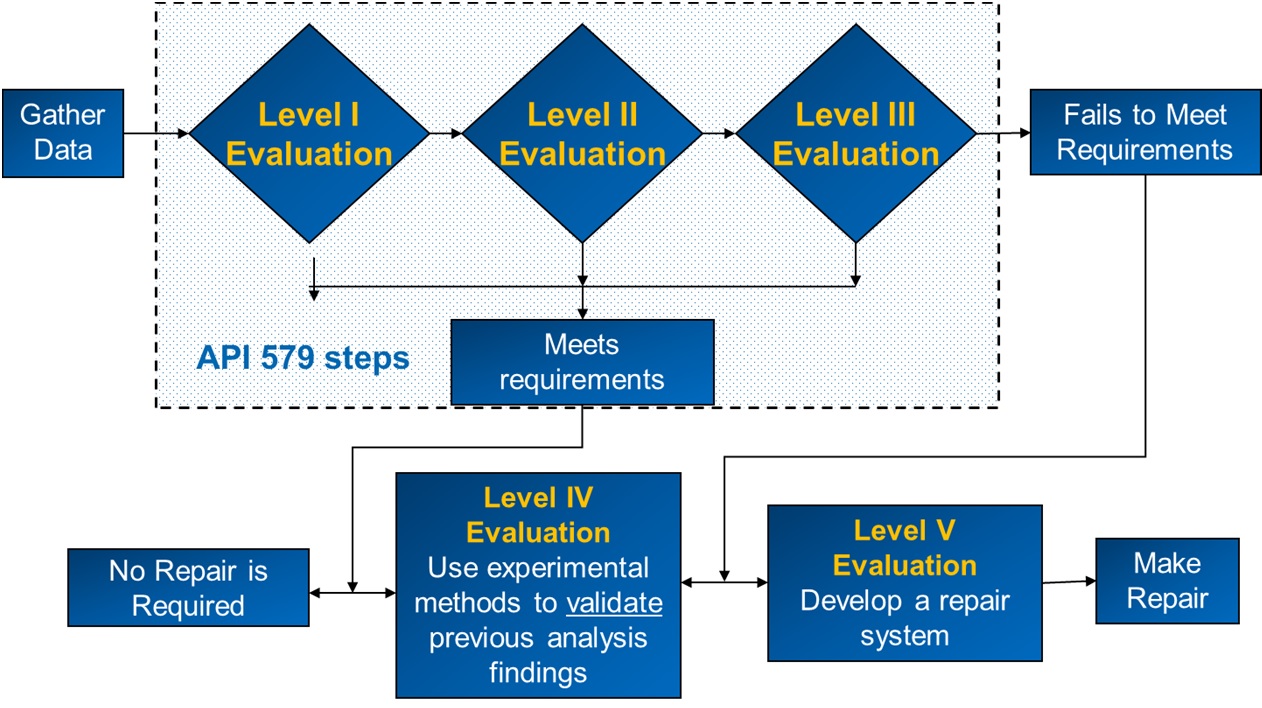
The resulting five-step process (Figure 1) provides operators with a complete solution for the specific threat with the intent of meeting code requirements for a reliable engineering solution.
After completing the five-step process in evaluating a specific pipeline anomaly, the objective is to develop a general purpose assessment tool that permits a general evaluation of similar imperfections. To do this, the tool creator must have a firm understanding of the respective anomaly, including critical variables and potential modes of failure.
Collecting Data
For most integrity assessments of buried pipelines, the first step is often ILI inspection of the pipeline to determine where additional scrutiny is required. In plants where piping is accessible, a wide range of inspection technologies are available including radiography, ultrasonic, and eddy current.
Following identification of the segment of concern, the detailed design, operating conditions and field measurements are gathered. These details are then used for the analysis. The data gathered will be used to determine the extent of the effort and perform the final analysis required.
For the proposed EB-IMP assessment method, collecting data will result in identification of critical variables. It might be that during this process, the operator will be required to perform a literature search to determine what variables govern the severity of a given pipeline anomaly.
An example of this was encountered by Alexander and Kulkarni in studying the severity of wrinkle bends. They found through research by Leis et al that the critical parameters that govern the fatigue life of wrinkles is their height, h, and length, L. Using this information, Alexander and Kulkarni developed a tool that permitted an assessment of wrinkles having h/L ratios from 0.1 to 0.5 and pipe to diameter wall thickness ratios ranging from 50 to 100.
Level I analysis – basic: The effort involves the most basic form of an analysis that is possible. Typically, this includes performing an assessment based on industry codes or standards. For most pipeline operators, this will mean referencing the original construction codes like ASME B31.8 for gas pipelines, and ASME B31.4 for liquid pipelines.
Level II analysis – detailed: This requires more detailed information. The efforts involved in this phase are more complicated and the results are less conservative than those using Level I methods.
Examples of what might be involved in a Level II assessment would be calculations based on closed-form solutions such as those contained in API 579-1/ASME FFS-1 or other engineering resources. This work is typically performed by an engineer experienced in pipeline design and operation.
Level III analysis – numerical (finite element analysis): When the Level I and II analyses indicate that either the operating pressure must be re-rated in the pipeline or that a repair is necessary, it is possible to perform a Level III assessment.
Numerical methods such as finite element analysis are the basis for a typical Level III assessment. The level of rigor associated with this effort is significant when compared to calculations completed as part of either a Level I or Level II assessment.
On the other hand, the reward for completing a Level III analysis is a reduction in the safety margin associated with the previously two levels and a greater understanding about the actual load capacity of the pipeline or component.
As a point of reference, a Level I assessment will provide the design pressure for a given pipeline system. However, a Level III assessment calculates the ultimate pressure for the pipeline and a design pressure is then calculated from that value, based on a given design margin. In this regard, the operator has a far greater understanding about the actual load capacity of his pipeline and the safety associated with his operation of the line.
A limit state approach such as embodied in API RP 1111, as opposed to the earlier referenced B31 codes, is applicable as it incorporates the ultimate capacity of the pipeline. This can be calculated either analytically using either the API RP 1111 closed-form equations or numerically calculated using finite element analysis.
Additionally, as will be discussed in the Level IV (testing) discussion that follows, full-scale testing can be used to determine the limit state condition. This approach not only improves confidence in the calculated results, but also facilitates regulatory approval if required.
Level IV – testing: The results of the engineering and FEA analysis can be confirmed via a testing program. Alexander has developed recommendation for the pipeline industry in using testing methods to augment integrity management efforts.
Testing can involve either pipe material removed from service or pristine pipe, depending on the desired outcome of the study. For example, if a pipeline company is interested in the performance of vintage girth welds subject to cyclic pressure service, it would be prudent to remove girth welds from the field and test them.
On the other hand, if an operator is merely trying to quantify the relative severity of different-sized dents in a girth weld, it would be possible to fabricate samples using modern pipes and welding techniques and then install the dents prior to testing.
Fundamentally, the question that must be asked prior to testing is if the interest lies in actually quantifying material properties or only seeking general trends such that qualification of an anomalies’ severity is sufficient.
As an example of testing as part of a Level IV assessment, a cyclic testing program can be used to simulate future service conditions of the system over a time period, such as 25 years of service. Cyclic testing of an unrepaired component can be used to predict the effects of future service on the component.
When the component passes burst test requirements and cyclic testing shows little or no degradation over time, these results can be used to support continued use of the unrepaired component. When unsatisfactory results are obtained from the cyclic testing, the decision to repair can be confirmed.
An additional benefit in using cyclic testing is that the results can be used to develop EB-IMP reassessment intervals for components that might fail due to cyclic loading that include degradation mechanisms such as mechanical damage, cracks, dents and wrinkles.
Level V – repair solution design: Remediation of common integrity threats can be accomplished using accepted repair procedures and these methods are, for the most part, well-suited and conservative. The information gathered and the analysis can also be used to develop a repair procedure tailored to meet the specific needs of the situation.
Tool Development
The tool is developed to replace the five-step process, thus providing pipeline operators with a simple documentable EB-IMP tool to make assessment and repair decisions.
It is essential when developing a general tool that the critical variables be used as the basis for choosing input parameters. Insights gained during the analysis and testing phases of work will confirm the validity and importance of the previously identified variables. Methods such as the Buckingham-Pi Theorem can be used to generally assess the contribution of a given variable to its effect on pipeline integrity.
Case Studies
To illustrate the EB-IMP assessment process two cases are presented. The first is a study performed on a catastrophic failure that occurred in a 30-inch cold reheat (CRH) steam line at the W.A. Parish Plant. The study involved numerical modeling involving computational fluid dynamics and finite element analysis, field instrumentation, and a full-scale mock-up test.
The second case study, although not specifically involving piping, involved an assessment performed on coal gondola cars that developed buckles in their top chords. The study involved finite element modeling and field instrumentation used to measure stresses during transportation and dumping of the coal.
Cold Reheat Line Failure
After a failure in a 30-inch cold reheat (CRH) steam line at the W. A. Parish Plant, TX, Genco conducted a study to determine the cause of the failure. The incident occurred at 12:10 p.m. July 15, 2003 and resulted in a catastrophic failure that scattered components across the plant in a radius of 1,200 feet.
Reliant Resources and Texas Genco conducted failure investigation that involved metallographic examinations, inspection of the fracture surfaces, review of operating conditions at the time of failure, and studies related to the weld profile of the CRH line.
Figures 2 and 3 are photographs from the failure analysis report showing the region where the failure occurred (on the inside surface at the toe of the weld) and a close-up view of the fracture surface. Of specific interest are the three fracture zones clearly shown in Figure 3 and listed below:
• Region 1 (76% of wall) – initial smooth fatigue fracture zone.
• Region 2 (16% of wall) – second rougher fatigue fracture zone.
• Region 3 (8% of wall) – final overload fracture zone that failed July 15, 2003.
The engineering efforts included studies using computational fluid dynamics (CFD) to address how droplet sizes from the attemperator might affect downstream behavior of the piping. The CFD analysis showed distribution of water considering droplet diameters of 0.1 and 10 mm. As expected, the smaller droplets are distributed farther downstream from the attemperator.
The field monitoring data, along with process data, were used to perform finite element analyses. The finite element work involved the calculation of static stresses as well as transient stresses generated by cycling of the attemperator (thermal stresses) and vibration of the line (mechanical stresses). Fracture mechanics was used to determine the amount of time required for crack initiation and propagation to failure.
The process demonstrated how a failure investigation can be coupled with testing, monitoring, and analyses to not only determine causes of failure, but identify specific steps to prevent future failures. The analysis and monitoring efforts clearly showed the operating conditions needed to produce the failure.
Coal Gondola Car Case Study
A power utility company experienced a series of isolated top chord buckles in their coal gondola cars. Buckled top chords are shown in Figure 4. The top chords of coal gondolas can buckle under certain loading conditions, driven by compressive loads in these structural members.
To determine the structural integrity of coal cars an investigation was undertaken using a range of tools that included finite element modeling, stress analysis during transport and coal dumping using onboard strain gages and an assessment of loads during the dumping operation.
Finite element modeling and limit analysis were used to quantify the loads responsible for the buckled top chords. One objective in the numerical modeling effort was to evaluate top chord reinforcing options. The optimized solution determined that welding 5-inch by 3-1/2-inch by 3/8-inch thick angle iron was sufficient to ensure that buckles would no longer occur in the top chords. The analysis also compared results evaluating benefits of reinforcing vs. top chord replacement. In terms of the EB-IMP, determining options for the reinforcement of the top chord is associated with Level 5 of the EB-IMP.
To quantify stresses generated in the gondola cars during transportation and dumping, strain gages were installed on the top chord as well as the side walls of the car.
There were many benefits from this investigation. First, the utility company determined the buckling capacity of the coal gondolas. Second, the company was able to assess the loads imparted to the railcar during transportation and dumping. Third, repair options were optimized.
Conclusions
The uniqueness of the EB-IMP approach is the integration of actual pipeline data, coupled with analysis and testing efforts, to generate a tailor-suited, engineering-based process that addresses specific threats to pipeline integrity. The result is that the process can address single critical integrity threats or can be used to develop a general-purpose tool to address a range of threats identified within a system.
The EB-IMP process involves basic engineering principles followed by testing to confirm analysis and reduce the potential for generating overly conservative restrictions on system maintenance and operation.
The result of this effort is a process, and tool when appropriate, that remediates integrity threats, optimizes maintenance dollars and generates documentation for in-house due-diligence efforts that can demonstrate system integrity to regulators and other interested parties.

Figure 2: Horizontal spool piece showing fatigue-cracked seam weld.
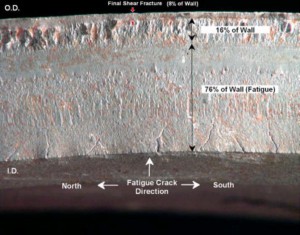
Figure 3: Close-up view of fracture showing distinct fracture zones.

Figure 4: Photographs of buckled top chord and associated fracture.

Comments