
May 2015, Vol 242, No. 5
Features
Study Shows Decreasing Emissions from Gas Distribution Systems
A study by a team from Washington State University (WSU) showed emissions throughout the United States coming from of natural gas distribution systems have decreased in the past 20 years, falling to levels 36-70% below current estimates.
The reduction were attributed to significant upgrades at metering and regulating stations, improvements in leak detection and maintenance activities and replacement of older pipeline materials.
“It was initially surprising to see such a large change in emissions for M&R stations, but after we understood how much these stations have changed, then it was understandable,” said Regents Professor Brian Lamb in WSU’s Laboratory for Atmospheric Research who led the study with assistance from Conestoga-Rovers and Associated, an environmental consulting firm study. Published in the peer-reviewed scientific journal, Environmental Science & Technology, the study provides the most comprehensive data yet on direct measurement of emissions from the distribution system.
The findings estimate emissions from the distribution systems range from 393-854 gigagrams per year, which is between 0.1-.2% of the natural gas delivered nationwide. Results from the study also suggest the number of pipeline leaks have fallen by 25% for mains and 16% for services lines.
“A concerted effort by natural gas utilities to upgrade our nation’s pipeline network in order to enhance safety has contributed significantly to a declining trend in emissions from the natural gas distribution system,” said American Gas Association (AGA) President and CEO Dave McCurdy.
Accounting for 50% of the study’s total measured emissions from pipelines were three large leaks from an unprotected steel main, a protected steel main and a cast iron main. This finding was not considered surprising by the researchers.
“The skewed distribution of leak rates and the presence of a few large leaks that account for most of the emissions is an obvious target for developing methods to detect and then repair the largest leaks,” Lamb said.
Since 1990, natural gas utilities have installed modern plastic pipes at a rate of 30,000 miles per year and installed cathodically protected coated steel mains at 1,500 miles per year, both connecting new customers and upgrading existing pipeline infrastructure, according to AGA records. During that time utilities have added almost 600,000 miles of distribution mains and service lines to serve 17.5 million additional customers.
“This work is important, and the study is unique,” said Lamb. “It is critical to do these careful measurements along the entire natural gas industry supply chain, so that we have a clear understanding of the impact of the industry’s greenhouse gas emissions. These are critical questions as our nation faces the challenges of energy, sustainability and climate change.”
Lamb’s project is part of a group of ongoing studies that are looking at the entire natural gas supply chain, from the production wells to the transmission pipeline system to local distribution systems. As part of the study, the research team carefully measured numerous sites selected from lists of known leaks provided by the 12 participating utilities in various regions around the country that met specific criteria to ensure a comprehensive and representative dataset.
The researchers took direct emissions measurements at 13 gas distribution centers around the country, including 230 randomly selected, representative leaks from underground pipelines as well as at 229 metering and regulating stations where natural gas is measured and regulated from higher pressure pipelines to lower pressure distribution pipelines.
According to the university, the AGA, Environmental Defense Fund, National Grid, Pacific Gas, PG&E and SoCalGas commissioned the study to measure methane emissions when gas is routed through local service and distribution main pipelines, as well as gas metering and regulating stations. The study is one of 16 studies performed with the participation of the EDF to get an overall sense of the methane problem, from natural gas production sites to the broader distribution network.
The U.S. Environmental Protection Agency’s annual Inventory of U.S. Greenhouse Gas Emissions and Sinks currently uses data collected in the 1990s in a study sponsored by the Gas Research Institute and the EPA. In fact, because of the significant differences they saw from data from the early 1990s, particularly from the metering and regulating stations, the WSU researchers revisited nine sites from the previous study and found an average of one-twelfth fewer emissions than 20 years ago from those M&R stations. The researchers also measured reductions in emissions from individual pipeline leaks as compared to earlier studies.
In its comments, the EDFT said, “The study confirms that when regulators and utilities both set themselves to fixing a problem, they can get good results. But,” said Jonathan Peress, EDF Air Policy Director for Natural Gas, utilities are losing as much as $195 million worth of natural gas each year. Because methane is a particularly potent greenhouse gas, 84 times more potent than CO2 over 20 years, the annual methane emissions are comparable in effect on the climate over a 20-year period to the CO2 from as many as 19 coal-fired power plants.”
EDF said it believes the study underscores three takeaways:
• Utility efforts and public policies to find and fix leaks – and to replace leak-prone pipe – are working. These efforts should be accelerated and expanded;
• Leak surveys and reporting by utilities should include the direct measurement of the amount of methane escaping;
• A small number of leaks cause a large share of emissions with big differences among utilities and regions. Both facts suggest case-by-case data is more telling than national averages.
The EDF noted that Utilities have invested heavily in replacing leak-prone hardware and infrastructure as both state and federal regulators have sharpened their focus on improving local distribution systems.
For example, EDF pointed out, the federal Pipeline and Hazardous Materials Safety Administration (PHMSA) introduced extensive new planning and monitoring rules for utilities in 2003, and the EPA issued greenhouse gas measurement and reporting requirements for gas utilities in 2011. About 40 states have replacement programs for leak-prone utility pipes, and 15 require leak classification and repair timelines. Additionally, 2011 EPA regulations require gas utilities to measure and report methane leaks from metering and regulating equipment.
As a result of these and other policies, companies have replaced close to 40% of the leakiest pipes that were in service in 1990, according to PHMSA. But that leaves 60% of these old cast iron and unprotected pipes still in the ground. At today’s rate, it will take at least another 50 years to replace them, according to EDF.
“Cast iron and unprotected steel represent less than 10% of the nation’s utility distribution system pipeline miles, but they are responsible for almost half of the total emissions from those systems,” Peress said. “More than a third of the emissions estimated in the study were in the Northeast, and 70% of the Northeast emissions were from old iron and steel pipes. Despite improvement over the past 20 years, many utilities are leaking far more harmful methane than is acceptable.”
“The leak with the highest emissions found in this study was a Grade 3 leak. Grade 3 leaks are defined as low safety risks and therefore are allowed to leak indefinitely. Better practices to find and quantify leaks can help ensure that big leaks like these are found and fixed quickly, saving money for the utility and its customers as well as reducing potent methane emissions.”
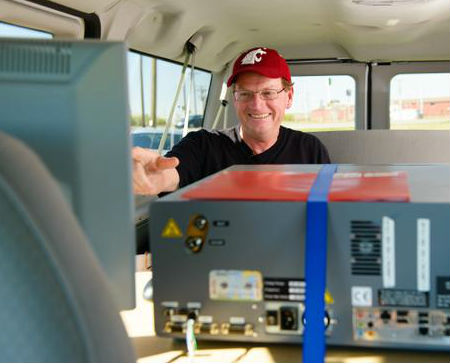
[inline:emissions_lamb.jpg]
Lamb

Comments