
March 2015, Vol. 242, No. 3
Features
Developing Crack Size Detection Criteria for Unpiggable Gas Pipelines
NYSEARCH/Northeast Gas Association (NGA) and development partner Invodane Engineering have introduced the Explorer series of robotic internal inspection platforms and sensors which can perform integrity assessments on natural gas pipelines now incapable of using conventional inline inspection (ILI) technology. The commercial partner on the project is Pipetel Technologies Inc.
The Explorer robots for 6-inch through 36-inch pipelines serve as a platform for nondestructive examination sensors capable of indicating the location, position, orientation, size and characteristics needed to preserve the integrity of the pipeline.
An important category of features relevant to assessment of pipeline integrity is the crack-like defect classification. Pipeline failures have been attributed to cracks or crack-like features in the body of the pipe, girth welds and longitudinal seam welds. With Pipeline and Hazardous Materials Safety Administration (PHMSA) co-funding, NYSEARCH/NGA members are advancing the development of crack detection and sizing sensors for the platform.
An important step in this development, applicable to all ILI inspections, is determining the specified requirements to detect flaws that could prevent pipeline failures. In addition, adjustments for the many factors that must be considered in this determination include tool crack detection size capabilities, tool error, pipeline material variability, pipeline class location and pipeline reassessment intervals.
Determining Defect Size
Operators want comprehensive defect assessment alternatives. One option is to conduct a hydrostatic pressure test to levels well above the operating stress or pressure level to establish whether a defect condition could impair the immediate integrity of a pipeline (allowing defects much smaller than would be critical at operating conditions to remain after a test).
Further consideration is given to account for crack size and depth uncertainties given material variability such as steel toughness and wall thickness, and inspection tool measurement error. Therefore, crack detection and sizing targets for both longitudinal and circumferential cracks and crack-like defects were estimated to be at least equivalent to those that would fail a hydrostatic test.
To address all crack-detection tool performance design considerations, NYSEARCH/NGA worked with Kiefner to establish performance criteria curves and tables for crack detection and sizing that cover all ranges of pipeline steel material variability, tool measurement error and pipeline stress.
This information can be used on a pipeline segment to quantify a pipeline crack inspection tool’s performance capabilities to detect and size cracks of sufficient size, depth and orientation to be considered critical or require monitoring based on the operator’s determination of the reassessment interval and the potential crack growth rate.
Longitudinal Cracks
Both deterministic and probabilistic analyses were employed using fracture mechanics to determine defect length and depths that would fail at specific hoop stresses. Kiefner’s pipeline test failure database was used to quantify material variability. Three categories of ductility were studied, including toughness, partial dependency on toughness and dependency on flow stress that corresponds to dependency on vintage ERW seams, moderate toughness midgrade steels and high-toughness, post-1980 pipe.
A series of normalized crack defect depth and length curves were produced, representing failures at the hoop stress for the specific class hydrostatic test pressure to operating pressure ratio in accordance with 49 CFR Part 192, Subpart J and ASME B31.8. Each curve represents the spectrum of flaw sizes from short but deep to very long but shallow flaws that will fail at a particular hoop stress.
After this deterministic analysis, a probabilistic analysis was performed for every pipe grade using Monte Carlo simulations. These simulations generated random values of strength properties based on their statistical normal distribution. Results were produced in a normalized form that would apply to all pipe sizes and grades. The probabilistic analysis also simulated the distribution of real-life defects and required fewer cases to yield the same results of the deterministic analysis (Figure 1).
Longitudinal Defects
The locus of points, determined from the range of all crack length and depth calculations that would fail at a particular hoop stress, can theoretically define the required ILI performance criteria for longitudinal cracks. A simplified approach is based on the critical sizes of long-shallow and short-deep defects.
This approach is derived from the observation that for any given operating stress level, there exists a continuous spectrum of critical flaw sizes from short but deep flaws to long but shallow flaws. The reason for this is short flaws are reinforced by the surrounding metal and long flaws are governed by the remaining wall thickness. On the other hand, the shorter the length of the defect, the deeper it can be in the pipe without causing a rupture.
The critical longitudinal defect size (failure at hoop stress allowed by the specific class design factor) and the monitoring longitudinal defect size (failure at hoop stress allowed by the ratio of the specific class hydrostatic test to operating pressure) were identified for each analyzed case (Figure 2).
The difference between the monitoring and critical flaw sizes is seen to be generally between 10-20% of the pipe wall thickness across all operating stress levels. In order for the ILI tool to substitute for a hydrostatic pressure test, the tool-sizing error must not encroach on this margin.
Tool Measurement Error
Tool measurement error can be adjusted based on repeated measurements of known defects or from NDE tool manufacturers’ claimed resolution. In lieu of specific data, adjustment factors can be provided in a representational form that can be revised on a case by case basis. Tool errors in the approaches that follow assume tool error is normally distributed with a zero mean and is comprised of a bias error (defined as a preference that inhibits impartial judgment) and a random error.
Assumptions of statistical distributions of measurement errors may be invalid if the NDE tool has a significant bias error. The bias would shift the mean of the measurement errors from zero by either a positive or negative value.
Measurement errors are reported in terms of tolerance such as percentage of wall thickness, and certainty, and can be converted to a statistical standard. Table 1 illustrates tool standard deviations at 80% probability of detection (POD). The standard deviation, along with a reliability percentage, is used to define recommended adjustments in the detection criteria.
As logically expected, the higher the required reliability of detection, the tighter the standard deviation of the tool has to be. Since all tools have error claims based on a certainty or probability of detection that must be accounted for, minimum detection limits and standard deviation measurements taken in infinite combinations ensure that a measured monitoring defect, plus the measurement error, do not reach or exceed critical defect sizes.
Tool Measurement Error
Two approaches were used to account for tool measurement error in crack detection sizing criteria. In the first approach, minimum detection limits are defined by the monitoring defect, and the standard deviation is defined by the difference between the monitoring and critical defects. With a 99.9% detection reliability (probability that a detected flaw is not critical enough to be critical in service), between 3-9% of the wall thickness would represent the required detection range.
This can be compared to a 12-16% wall thickness standard deviation range that is much lower for many typical ILI tools (corresponds to 15-20% at 80% certainty (POD) as reported by the tool manufacturer and assuming a normal distribution error). If 95% detection reliability is selected (meaning that 95% of the time the pipe will have a higher strength level and consequently can tolerate a larger defect depth), the required standard deviation of the tool for Class 1 locations would be between 8-14% of the wall thickness and would overlap with many ILI defect detection capabilities.
In Figure 3, the upper dashed curves represent critical flaw sizes for the operating stress, the heavy solid curves represent critical flaw sizes for the required hydrostatic test level for the respective operating class and the tool measurement error is accounted for by the four light solid curves assuming 5% to 20% error at 80% certainty (POD).
In the second approach, the detection limit is lowered for specific standard deviations so the measured defect enlarged by the measurement error does not exceed the “monitoring” defect size. As illustrated in Figure 4, with a 99.9% reliability detection limit for an ILI tool with an error of ±20% at 80% certainty (equivalent to a standard deviation of 15.6% of wall thickness from Table 1), the detection limit would be about 68% of the monitoring defect size. For a tool with a ±10% error, the detection limit would be about 81% of the monitoring defect size.
If the monitoring defect size is considered for detection (as it will be smaller than the critical defect size), the additional margin of safety would account for uncertainties in material property and hoop stress, as well as tool measurement errors.
Circumferential Size
Critical circumferential defects are not effectively determined by hydrostatic testing. Axial stresses due to pressure and constrained thermal stresses do not exert a tensile stress large enough to lead to failure. Axial stresses from soil movement or other natural events that could cause large circumferential cracks or crack-like defects to become a pipeline integrity threat must be considered.
The failure assessment diagram (FAD) procedure used to develop the alternative welding workmanship in Appendix A of API 1104 was used for this determination with two options. Option 2 allows the use of specific ductility values – crack tip opening displacement (CTOD) values are used – and Option 1 allows pre-developed ranges for defect depth and length tied to two levels of weld ductility.
Critical detection targets correspond to axial stress levels of 60% and 75% specified minimum yield strength (SMYS) and monitoring detection targets correspond to the axial stress level of 90% SMYS. These targets were determined using analysis, which is limited to defect lengths of 25% of the pipe circumference and are not applicable to dynamic loads with strain rates higher than 10?³ seconds?1 to an axial stress increase of about 30 kilo-pounds per square inch (ksi)/second.
Reassessment Intervals
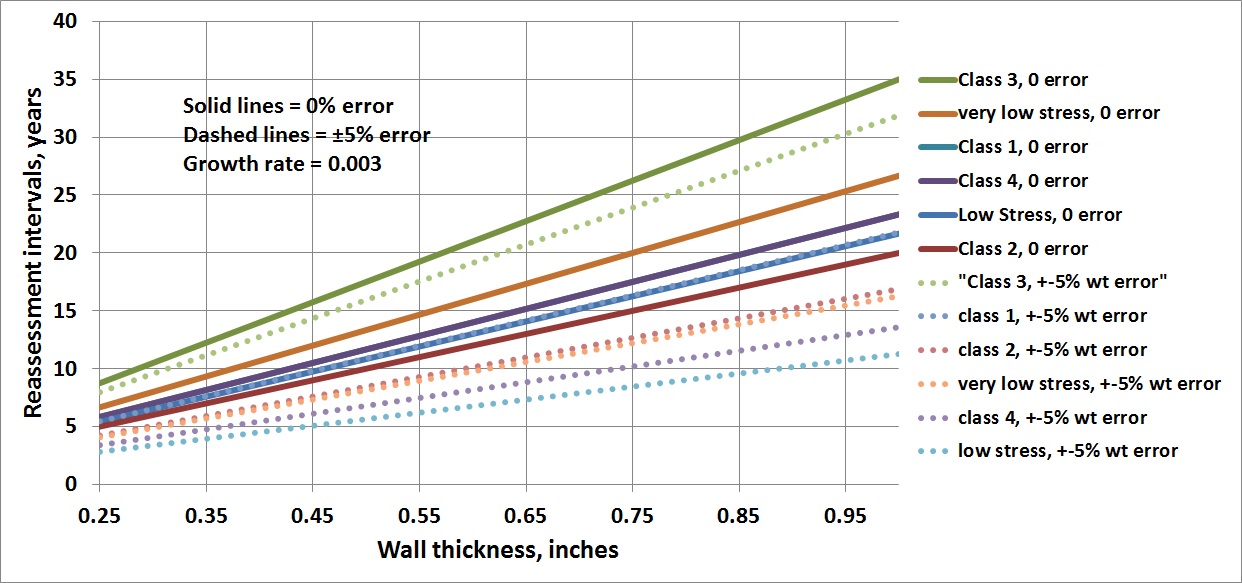
Based on a safety factor of 2, reassessment interval curves were completed for all class location stress levels, assuming crack growth rates in multiples of 3 mils per year (mpy). The various curves for different class locations were created for both longitudinal and circumferential defects as a result of the absolute difference between the monitoring and critical defects (Figure 6).
For longitudinal cracks, the reassessment interval is a direct linear relationship to the pipe thickness because the thinner the pipe, the shorter it takes for a crack to grow the same percentage of thickness at the same crack growth rate. For circumferential defects, the minimum depth to thickness ratio occurs at a length to circumference ratio of 0.2.
This ratio is used to define the reassessment interval. The reassessment interval is longer whenever the difference between the critical and monitoring defect is larger. This is why the reassessment interval is considerably longer for the axial stress level of 60%, compared to 75% SMYS.
Conclusion
There is no single crack defect detection size and depth target. It varies with application by the yield stress, pipe size, location and orientation on the pipe, and stress level. Material property variability, tool measurement error, class location and inspection reassessment intervals also need to be taken into consideration when developing crack defect detection criteria for inspection tools.
The required sensitivity for low strength and moderate toughness steel pipelines is within many ILI tool defect detection capabilities, but the required detection limits for higher strength and lower toughness pipes and very short or very deep crack defects represent a technology development challenge.
Authors: David Merte is senior project manager with NYSEARCH/Northeast Gas Association, responsible for several program areas including pipeline integrity, pipeline repair and rehabilitation, and real time sensing. He is a registered professional engineer in New York.
Mike Rosenfeld is chief engineer with Kiefner and is involved in a variety of pipeline integrity projects. He is a member of ASME B31.8, a registered professional engineer in Ohio and an ASME Fellow.
[inline:GPJ Fig2.jpg]
Figure 2: Trend of difference between monitoring and critical defects for Grades A, B, X42.
[inline:GPJ Fig3.jpg]
Figure 3: Detection requirements for Class 1 pipelines (Grades A, B, X-42, all material moderate and high toughness).
[inline:GPJ Fig4.jpg]
Figure 4: Results for Grades A, B and X42.
[inline:Fig5.jpg]
Figure 5: Minimum detection requirements for circumferential defects in 6- and 8-inch pipe.

Figure 6: Estimated reassessment intervals for differing operating stress levels.
Table 1

Comments