
August 2014, Vol. 241, No. 8
Features
Oil Prices Rise As World Walks Supply-Demand Tightrope
The world is walking a tightrope of oil supply and demand. Today, supply exceeds demand by a very small amount. This difference is small enough that a major disruption in supply can further tip the balance in the direction of demand.
More importantly, the trend is toward flat to declining supplies and increasing demand. Given this, the possibility exists that worldwide demand will exceed the available supply in the foreseeable future. At that point, the difference has to be made up by increasing supply, reducing demand, or by drawing on available reserves.
The balance between oil supply and demand has a direct effect on oil prices, and most of the advanced economies of the world depend on having an adequate supply of oil. The world’s oil comes from many different countries with differing political and economic structures and alliances. Major sources of oil include countries as diverse as Canada, Iran, Iraq, Mexico, Venezuela, Russia, China and Saudi Arabia.
While the need to keep oil flowing from the Middle East to the United States may not have been the primary motivation for the wars in Iraq in 1991 and in 2003, it certainly played a role in the decisions to undertake these wars. Every country has a vital need for oil and any threat to a country’s oil supply can be perceived as a threat to that country’s security.
The price of oil is normally measured in terms of the price of a barrel of crude oil which contains 42 gallons. Even this pricing figure is not exact since different oils from different parts of the world have different prices at any given time. As a result, certain crude oils tend to be used as “benchmarks” for the price of oil as a whole. These include the price of West Texas intermediate (WTI) Crude Oil (United States), Brent crude oil (Europe and Africa), and Dubai and Oman crude oil (Middle East). Of course, there is also a difference between what oil is selling for at any given time, and the futures price.
The strongest reason for the high price of crude oil is the balance between supply and demand. Supply exceeded demand by less than 1 MMbpd in 2012. However, many of the upward fluctuations in price are due to actual or perceived threats to the oil supply from the major oil-producing countries. When the oil supply is threatened from any major oil-producing country, prices typically rise on fears of reduced supply.
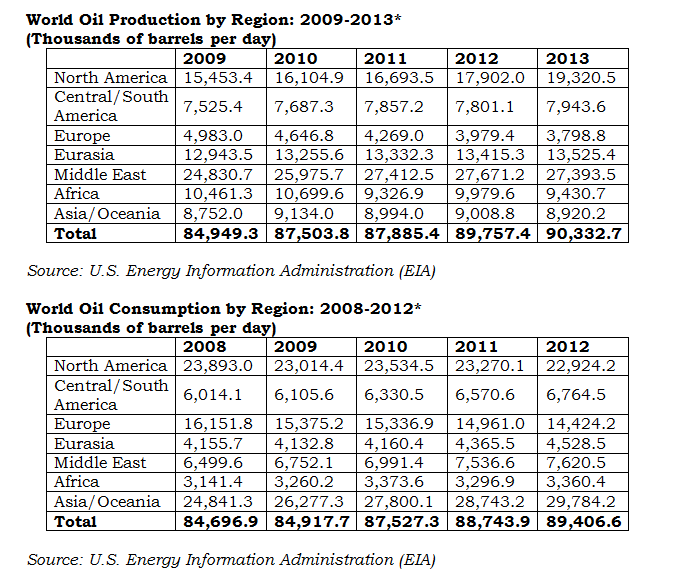
Comparing crude oil production with petroleum demand by geographic region not only shows how tight the balance is between supply and demand, it also explains a lot about the current oil market. The following table makes such a comparison. Note that while 2013 data is available for oil production, the latest year available for petroleum consumption figures is 2012.
To better understand the implications, it is important to be aware that North America includes the United States, Canada and Mexico. Since the numbers for the United States are of special interest, it is worth comparing oil production and consumption just for the United States:

Looking first at the U.S. table, it shows that the consumption of petroleum liquids declined by about 1 MMbpd from 2008 to 2012. This is a significant reduction, brought about by increased efficiencies in the use of petroleum liquids, greater use of natural gas and a slow move toward alternative energy.
The table also shows U.S. oil production increased significantly from 2009 to 2013. This is due to superior oil drilling technology, to increased drilling offshore, and to the advent of shale oil. All of these factors are causing an increase in total U.S. oil production.
Despite the good news about increased production and reduced consumption, there still remained about a 7 MMbpd difference between supply and demand in the United States for 2012. This shows why the United States has to import foreign oil which has become a major political issue in the U.S. In order to adequately supply itself with oil, the United States has had to deal with some unfriendly countries. It has also had to deal with and support authoritarian and non-democratic regimes in order to make up the required quota of oil to satisfy U.S. petroleum demand.
Regional Breakout Implications
The regional supply and demand chart makes it clear that Europe consumes far more oil than it produces. As a result, Europe is dependent on imported oil from countries such as Russia, Saudi Arabia, Libya, Iran and Nigeria. While the North Sea remains a significant source of oil for Europe, oil production from that area is declining as these fields have produced less oil over time. It is the reduced production from the North Sea fields that sparked research into multiphase flowmeters in Norway in the early 1980s.
Eurasia is a major producer of oil and it produces far more oil than it consumes. Eurasia as defined by the Energy Information Administration (EIA) mainly includes the former Soviet Union (FSU), including Russia, Ukraine, and Kazakhstan. Russia accounted for 78% of oil production by Eurasia in 2013. Russia is blessed with vast natural energy sources and is the world’s leading producer of natural gas and third-leading producer of crude oil.
Another important fact that stands out clearly in the regional segmentation of oil production and consumption is that, like Europe, Asia/Oceania consumes far more oil than it produces. China is the leading oil producer in this region.
In 2013, China produced 50% of the oil from the region. The Asian and Oceanic countries, which include China, Japan, Australia and India, do not contain large amounts of either oil or natural gas. Instead, they rely heavily on coal and, in some cases, nuclear power to produce energy.
Because many of these countries are islands, or border on the Pacific or Indian oceans, a portion of their oil and natural gas is supplied by ship rather than pipeline. This explains the tremendous surge in liquefied natural gas (LNG) liquefaction and regasification facilities worldwide.
Natural gas is cooled at a liquefaction facility so that it can be transported by ship. It is then shipped to its destination where the LNG is converted back to natural gas at a regasification facility. It is then put into pipelines or transported by truck for commercial, industrial, and residential use.
Asia/Oceania imports its LNG and oil from many sources, including the Middle East, Europe and the United States. Some LNG is produced within the region. The massive Gorgon Project off the west coast of Australia is being built at a cost of $54 billion and is scheduled to supply LNG to India and other countries in Asia/Oceania. While some LNG projects were canceled in the United States after the beginning of shale oil and shale gas production, some companies are taking a new look at LNG exporting, given the growing need in Asia for LNG.
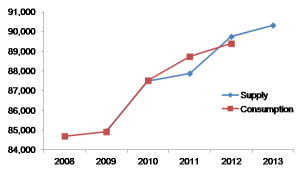
Supply-Demand Effect
Because the balance between world supply and demand is so tight, a constriction in supply, or even the anticipation of such a constriction, can have an impact on oil prices. The same can be said for a sudden balloon in demand since a demand increase also upsets the supply-demand balance.
The chart shows the pattern of oil prices over the past three years. The red line refers to Brent crude oil while the blue line refers to WTI crude. For most of July 2011, the price of WTI was between $95-100 per barrel. Since that time, WTI prices have fluctuated between $80-100 per barrel. Currently, the average price of a barrel of WTI is in the range of $100 per barrel, although most recently it has exceeded that figure.

WTI is of very high quality and excellent for refining a larger portion of gasoline. Its API gravity is 39.6° (making it a “light” crude oil), and it contains only about 0.24% of sulfur (making a “sweet” crude oil). This combination of characteristics, combined with its location, makes it an ideal crude oil to be refined in the United States, the largest gasoline-consuming country in the world. Most WTI gets refined in the Midwest with some more refined within the Gulf Coast region.
Brent crude oil is actually a combination of crude oil from 15 different oil fields in the Brent and Ninian systems located in the North Sea. Its API gravity is 38.3° (making it a “light” crude oil, but not quite as “light” as WTI), while it contains about 0.37% of sulfur (making it a “sweet” crude oil, but again slightly less “sweet” than WTI). Brent is ideal for making gasoline and middle distillates, both of which are consumed in large quantities in Northwest Europe, where Brent is typically refined.
The difference between the price of WTI and Brent crude oil varies from about $5 per barrel to $20 per barrel, with Brent being the more expensive of the two. As the chart shows, the price of Brent has been consistently higher than that of WTI over the past three years, and has been above $100 per barrel for most of that period.
")
As the chart shows, the top oil-producing country worldwide in 2012 was Saudi Arabia, followed by the United States and Russia. There is then a significant drop-off to other countries, such as China, Canada and Iran. What is of special interest in this list is that it includes countries that have experienced political and economic instability which has had an effect on the price of oil. These countries especially include Russia, Iran, Iraq, Kuwait, Nigeria and Venezuela. Other countries not on this list but large enough to influence world oil prices recently include Ukraine, Egypt and Syria.
‘Orifice Plate’ Effect On Production
Because the balance between world oil supply and demand is so tight, an unexpected reduction in supply, or an anticipated reduction, can have an immediate effect on oil prices. This works somewhat like the effect that an orifice plate has on fluid in a pipe.
An orifice plate constricts the flow by forcing all the flow through a narrowed opening in the pipe, speeding up the flow and causing a pressure drop. Orifice plates are used to compute flowrate, which is calculated with a differential pressure transmitter.
With the supply-demand balance so tight, any sudden actual or perceived future drop in oil production in a country that produces significant amounts of oil can have an immediate effect on the price of oil. In most cases, the price of oil increases as a result of the “orifice plate” constriction. This effect can be temporary or long-lasting, but the numbers of such occurrences in the past several years have served to push up oil prices and keep them high.
Much of the world’s oil in fact comes from countries that have experienced political or economic instability that has threatened oil production. Examples include Saudi Arabia, Russia, Nigeria, Iran, Iraq, Kuwait, Syria, Egypt, Mexico and Venezuela. Alhough Ukraine is not a major oil producer, the political unrest there caused instability in oil prices because it was not known what Russia’s actions would be.
Events of the Arab Spring have also contributed to the orifice plate effect; this instability continues, for example, in Egypt. After the resignation of Hosni Mubarak in February 2011, the military became the main governmental decision-maker. Egypt’s first democratically elected government was elected in June 2012 and then dissolved in July 2013. Now there is a tug-of-war for power among the military, judiciary and dozens of political parties. This instability has led to a gradual decline in Egypt’s oil production.
The instability in Iraq and Syria has also driven oil prices higher. After U.S. troops departed Iraq in 2011, it was left to Prime Minister al-Maliki to create a stable situation. This has proved difficult because Iraq’s population is divided among three different ethnic and religious groups which have historically had a difficult time getting along with each other. Lately the region has been torn apart by sectarian violence that threatens the very existence of the country.
In February, crude oil production in Iraq rose to 3.6 MMbpd, its highest level since 1979. In June, however, oil prices rose on anticipation of reduced output in Iraq. One mitigating factor is that most of Iraq’s oilfields are in southern Iraq, away from the fighting in the northern part of the country.
Future Of Oil Prices
While oil prices are difficult to predict, it seems likely they will remain in the range of $100 per barrel and above for the foreseeable future. Because the orifice plate effect can potentially occur in any major oil-producing country, and because so much of the world’s oil comes from regions that are subject to periodic economic and political instability, the upward trend in oil prices can be expected to continue. Ours is not a stable and peaceful world in many places, and steady oil prices depend on peace and stability. In the meantime, higher oil prices will accelerate the push toward natural gas and alternative forms of energy, including renewables and nuclear energy.
Flow Measurement Implications
Flowmeter suppliers have been responding to higher oil prices by developing more accurate and reliable products designed to measure oil flow. In particular, four suppliers have introduced larger Coriolis flowmeters designed to measure oil flow in pipes with diameters from 8 to 16 inches. These include GE Measurement (Rheonik), Emerson Micro Motion, Endress+Hauser and Krohne.
Ultrasonic suppliers have also developed more sophisticated multipath flowmeters that incorporate self-diagnostics, reduce the need for upstream piping and have increased reliability. Turbine meter suppliers have responded with innovations of their own. Most of these flowmeters are designed for custody transfer applications.
As the price of oil increases, so does the need to measure it accurately and reliably. And so also does the willingness of end-users to pay for flowmeters with enhanced capabilities. The average selling price of multipath ultrasonic flowmeters is in the range of $35,000, while many of the new larger Coriolis flowmeters cost in the $75,000 range.
Expect continued new product development and introductions from these suppliers as they work to keep pace with the growing demand for oil flow measurement and the increase in energy production and consumption worldwide.
Author: Jesse Yoder, an internationally recognized expert in metering research, is a frequent contributing editor to Pipeline & Gas Journal. He leads Flow Research, Inc., Wakefield, MA, and can be reached at jesse@flowresearch.com. He has 27 years’ experience as an analyst and writer in process control and has written more than 160 market research studies in industrial automation and process control in addition to more than 220 published journal articles on instrumentation topics.

Comments