
June 2014, Vol. 241, No. 6
TechNotes
Improving Field Verification In Pipeline Integrity Management Programs
An inline inspection (ILI) project is not complete until the reported features are verified in the field. The process is important because inappropriate inspection techniques can invalidate an otherwise valid report.
Field verification of reported features has two important aspects in that it helps confirm:
• The reported features confirming the condition of the line to the operator and helps support any actions that may be taken.
• The tool performance for use on other lines where dig verification is not possible.
Verification is necessary for conducting repairs and preventative maintenance without unnecessarily risking operator safety. Factors of safety (FOS) can only be used effectively if the tolerances being used to calculate the FOS match those provided by inspection, or are more conservative in nature.
It is not acceptable to use sizing tolerances that are not conservative, which means the actual measured dimensions are greater than those predicted, even with the tool vendors tolerance added.
Why is there need for better pipeline anomaly measurement and analysis? There are many reasons:
• ILI is not a silver bullet.
• Hydrotesting, including “spike” testing, is simply a momentary stress test with little-to-no-field (dig) verification standards for failure other than repair.
• Direct assessment (DA) and ILI technologies and tools have advanced significantly. However, field (dig) data collection for prove-ups and operator qualifications have not kept pace.
• Non-destructive evaluation (NDE) and tools from other industries have been adopted for use in field (dig) verification. However, use of the right technology or tool and data accuracy, reliability and repeatability limitations has had narrow results.
• Data analysis can improve but requires more accurate, reliable, consistent and repeatable electronic data.
• Data bandwidth and storage technologies are capable of supporting improved ILI data algorithms. However, industry warehousing of non-proprietary data is essential.
The Pipeline Operators Forum has provided some guidance to the pipeline industry by attempting to pull together existing standards, procedures and recommended practices (API 1163, ASME B31.4, ASME B31.8, ISO 9712, EN 473 or equivalent).
Nonetheless, the December 2012 guidance document was simply the start and did not include guidance on standards, procedures and recommended practices for NDE from the American Society for Nondestructive Testing (ASNT) or corrosion prevention guidelines from National Association of Corrosion Engineers (NACE).
Anomaly Verification
Smart pigging has taken on an even more critical role with the promulgation of integrity management rulemaking in the last several years. In some situations pigging is not the best or preferred inspection method for various reasons, especially if the technology is misapplied, oversold or the pigging process and information mishandled.
It is extremely important to recognize those situations where smart pigging technologies have not advanced sufficiently, or the pigging process is incomplete, such that it interferes with inspection quality. In such misapplications, ILI may not be effective or warranted. It is crucial to properly communicate to the industry and the public the appropriate limits of this technology, especially those tools still in development.
It is necessary to determine the performance of the inspection in order to conduct the required repairs and preventative maintenance plans with the certainty of risk required by the operator.
FOS can only be used effectively if the tolerances being used to calculate the FOS actually match those provided in the inspection report, or are more conservative in nature. It is not acceptable to use sizing tolerances that are not conservative, which means the actual measured dimensions are greater than those predicted, even with the tool vendors tolerance added.
Most ILI suppliers will provide support for field verification activities. The ILI suppliers are not just interested in when the ILI tool has not performed to specification. They need quality field data to help verify the tool performance specifications for a range of feature types.
To achieve consistency with data collection it is necessary to set standards and protocols that must be followed. This requires trained field personnel to gather the data so that the results can be relied upon. The techniques and equipment used must be tested and certified in calibration. The calibration and device tolerances must be taken into account when evaluating the results.
Significant problems have occurred when reported feature sizes are incorrectly measured in the field. This has an effect not only on the verification of the reported features but also on determining the tool performance. Field personnel assigned to dig verification need to be certified to use the equipment.
Table 1
*The table referenced from Pipeline Operators Forum, December 2012 “Guidance on Field Verification Procedures for Inline Inspection.”
It is important to have consistent and reliable standards. The anomalies must be accurately measured in length, width and depth. When evaluating anomalies it is important to understand the extent of the anomaly and how its interaction with adjacent anomalies is accounted for in the verification process.
It is important to realize the need to improve and evolve inspection methods and not fall into the illusion that the technology or the IM process is foolproof. Poor application of even the best inspection methods will not compensate for imprudent management or poor risk assessment approaches on pipelines, for example.
New regulations set baseline inspection and re-inspection intervals for pipelines in high-consequence areas (HCAs). All too frequently the pigs aren’t smart enough for various operating reasons or the operator is running the wrong pig.
It makes greater sense to improve the overall ILI process to ensure quality results from proper inspection tool choices and proper management processes, especially as the technology advances. This is particularly important for the types of pigs dealing with highly specialized pigging threats in which technology has not been completely developed. Advancing the quality of inspections establishes a high confidence in the pipeline’s integrity.
Direct Examination
Whether one uses the direct assessment or ILI method, direct examination often requires excavation of a portion of a pipeline. Given the frequency of anomalies identified in ILI runs, it is not uncommon for a pipeline to require several hundred excavations annually at a cost of tens of millions of dollars.
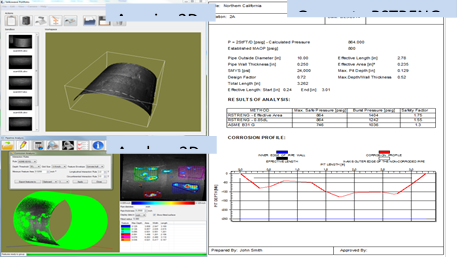
An alternative method of measuring anomalies on pipelines uses the 3D Toolbox, an analytical software package paired with a 3D imaging system that is based on a technique commonly referred to as structured light illumination. Once the 3D data is acquired, the data is then analyzed for areas of metal loss. Measurement error can be introduced in either the 3D data acquisition or the 3D analysis step.

Accurate 3D measurements form the basis for determining metal loss and metal deformations. However, accurate 3D measurements are not sufficient to determine the extent of damage on a pipeline, as the original condition of the pipe needs to serve as a baseline for the 3D analysis.
With the 3D measurement representing the current condition of the pipe, the data is separated into both damaged and undamaged regions of the pipe. Once the undamaged points have been identified, these points can be used to form surfaces, which then become the reference against which damaged areas are measured to determine the extent of metal loss or metal deformation.
The overall process involves:
• Acquisition of the raw 3D data
• Analysis of the 3D data, including establishing the reference surface, determining defect areas and depths, and calculating the river bottom profile
• Generate an RSTRENG (external pipeline corrosion evaluation software) methodology calculation and report
All measurements have errors. Table 2 summarizes major sources of error associated with the use of 3D data.

In order to determine the measurement errors, known values must be established. A major West Coast operating pipeline company study used a coordinate measurement machine (CMM) device to accurately measure the surface of pipes with corrosion and pipes with dents.
Because the accuracy of the CMM was expected to be almost two orders of magnitude better than any other technique, all CMM measurements were considered to be the true value. Five areas were investigated in this study: three areas of corrosion and two pipes with dents.
In addition, 10 defects were selected in each area of corrosion. The deepest point for each defect was measured by a conventional pit gage, the 3D Toolbox, a 3D structured light system from Seikowave, and the CMM. The CMM was programmed to take data in a rectangular array with a circumferential pitch of 50 mils and an axial pitch of 100 mils.
Because the CMM was not programmed to search for the deepest points of corrosion, there was some probability it might not measure the deepest point for all defects. The errors associated with the data from all five errors were in agreement. This article focuses on data from one sample.
The pit gage data was acquired over the course of a day. The CMM data took more than three days to acquire. All data using the 3D Toolbox was acquired within a few hours.
This comparison of the CMM data points and the 3D Toolbox data points shows that within a 1-square-inch area, there are 200 CMM points. In this same area, the 3D Toolbox produces a model with 2,500 points. Overall, the agreement between the CMM data and the 3D Toolbox data is within 4 mils for 77% of the data, with 90% of the data was within 6 mils.
The major deviations occur in areas where the sampling frequency of the CMM was not high enough to capture the change in the shape of the pipe. Typically, this occurred in areas where corrosion was present.
While the comparison between the CMM and the 3D Toolbox data showed excellent agreement, this result did not determine if the latter could accurately determine metal loss. To verify this, the 3D Toolbox analysis software was used to calculate the depth at 10 specific locations. The depth values were then compared to those made by the CMM. Both depth measurements were also compared to pit gage measurements.
Conclusion
This study focused on establishing the error of the raw data collected by the 3D Toolbox and the depth calculations determined by the analysis software. Unlike most 3D imaging systems – where error is reported on a global basis – this study focused on determining error on a point-by-point basis.
This is necessary because maximum allowable operating pressure (MAOP) calculations are driven by the deepest points of corrosion and not by an average metal loss over a large area. Consequently, understanding the error associated with individual measurement points is critical to determining if the MAOP calculations are valid and, ultimately, if the pipeline is safe.
Based on the data, the deviations from the CMM points were determined to have an average value of zero and a standard deviation of 4 mils. The ability of the 3D Toolbox to accurately determine the depth of a corrosion pit was calculated to be within 2.2 mils of the CMM, on average.
In actual field use the 3D Toolbox demonstrated the ability to obtain fast, accurate and repeatable measurements in a fraction of the time of conventional methods.
Other benefits included:
• Repeatability – The device will capture the same 3D measurements 100% of the time from any angle by any person using the device.
• Calibration – The device is calibrated at the factory and is National Institutes of Standards Testing (NIST) traceable. If it is not calibrated it will not operate.
• Ease of use – It is operated just like any standard 2D camera without special training; images are captured in microseconds.
• Speed – The 3D images can be captured in fractions of seconds and stitched together in minutes. Thus, a complete corrosion inspection, analysis and final decision takes minutes, not hours or days.
• Accuracy – Tests show it equal to or more accurate than laser technology.
• Cost – It is far less expensive than laser scanner (fixed or portable) devices.
API 1163 does not require mandatory field verification (sometime called calibration) digs of smart pig runs. There appear to be enough process checks in the standard, however, to provide adequate guidance on the importance of verifying the pig vendor’s claimed tolerance standards for cited anomalies.
In all fairness, for those rerunning pigs, new field verification digs may be somewhat onerous as the pipeline can usually calibrate confidence in tolerance for a particular pig against field verifications used from previous pig runs. For those operators utilizing ILI for the first time, or running pigs that are “pushing” developing technology (such as some of the specialty pigs), failure to use field verification digs could be most unwise.
Regulation is very clear: the responsibility for the pipeline integrity rests with the pipeline operator. As someone wisely said, “A pipeline operator cannot contract out their pipeline integrity management program.”
Another point concerning field verification digs, as any junior engineer who has taken a usually required basic statistics course knows, one or even two field digs is insufficient to develop a verification plot or “unity graph.”
Conversely, one doesn’t need hundreds of field digs on one pipeline to confirm the tolerance claims of a pig tool. A prudent operator should budget accordingly for field verification as needed in their IM program using ILI.
Author: Joe Summa is president and CEO of Technical Toolboxes, Inc., a provider of integrated pipeline software and research documentation for pipeline engineering and technical professionals. Summa earned a master’s degree in chemical engineering and bachelor’s degree of science from Lehigh University in Bethlehem, PA.

Comments