
May 2014, Vol. 241, No. 5
Features
Study Estimates U.S. And Canadian Midstream Investments At $30 Billion Per Year
The U.S. and Canada will require annual average midstream natural gas, crude oil and natural gas liquids midstream infrastructure investment of nearly $30 billion per year, or $641 billion (real US$2012) total over the 22-year period from 2014 to 2035, a new study found.
The report, North American Midstream Infrastructure through 2035: Capitalizing on Our Energy Abundance, conducted by ICF International on behalf of the INGAA Foundation, updates a 2011 infrastructure report to reflect dynamic changes in the natural gas, NGL and crude oil industry in recent years. America’s Natural Gas Alliance was a co-sponsor of the report.
The objective of the study was to inform industry, policymakers and stakeholders about the new dynamics of North America’s energy markets and the infrastructure that will be needed to ensure that consumers benefit from the abundance of natural gas, crude oil and NGL across the U.S. and Canada.
The report noted that about $14.2 billion per year, or $313.1 billion total, midstream natural gas investment will be needed from 2014 to 2035 to accommodate new gas supplies, particularly from the prolific shale plays, and growing demand for gas in power generation, industrial applications and exports. Natural gas midstream infrastructure includes mainlines, laterals, processing, storage, compression and gathering lines.
Meanwhile, about $2.5 billion per year, or $56 billion total, of investment will be required for NGL infrastructure (transmission pipelines, pumping, fractionation and NGL export facilities), while $12.4 billion per year, or $271.8 billion total, of investment will be needed for crude oil infrastructure (gathering pipeline, lease equipment, mainline pipeline and pumping, storage laterals and storage tanks).
This total midstream investment is expected to create more than 432,000 jobs, add about $885 billion to U.S. and Canadian economies, and bring in over $300 billion in federal, state/provincial and local taxes.
“This report shows a vibrant natural gas market in the future, and it also demonstrates the need for additional midstream infrastructure to support natural gas fulfilling its potential as a foundation fuel for our energy economy,” said INGAA Foundation President Don Santa. “The good news is that the natural gas industry has a proven track record of financing and constructing this level of infrastructure.”
Santa said because of the linkage between natural gas, crude oil and NGLs, it has become necessary to view energy pipelines in holistic terms.
“While the foundation has done its flagship natural gas infrastructure reports for over 20 years, the last two reports have broken new ground by recognizing the importance of including NGL and crude oil infrastructure to provide a broader prospective on how prices and production of the three commodities can impact the market and infrastructure development,” he said.
“Pipelines make the shale revolution possible – whether it’s shale gas, tight oil or NGLs,” Santa added. “Without pipelines, Americans cannot benefit from these bountiful U.S. resources.”
The study also found that new infrastructure will be required to move natural gas, NGLs and crude oil from regions where production is expected to grow and to areas where demand is expected to increase. Not all areas will require significant new pipeline infrastructure, but most areas will require new investment to connect new supplies to markets.
The study is broken down into a base case and low case scenario. For the purpose of the report, only the base case is discussed in detail.
Base Case Outlook
The report’s base case assumes U.S. growth at an average rate of about 1% per year and U.S. GDP growth at an average 2.8% per year in 2014 and 2.6% from 2015 to 2035. Electric load is assumed to increase at an average 1.5% per year through 2020 and 1.1% per year from 2021 to 2035, while oil prices average $100 per barrel in real terms.
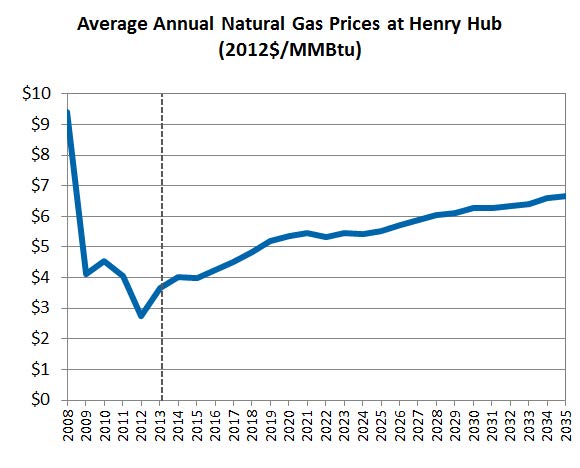
Insert Graph from report on Pg. 4: Average Annual Natural Gas Prices At Henry Hub
The base case projects that Henry Hub gas prices will average about $US6 per MMBtu in the longer term, at an assumed crude oil price of $100 per barrel in real terms. A $5-6 per MMBtu gas price is seen sufficiently high to encourage substantial gas supply development, but not high enough to limit market growth. In the reference case gas price scenario, both gas supply and demand are expected to increase significantly over time. This growth, when combined with regional shifts in supply and demand over time, creates a positive environment for midstream infrastructure development.
Resource And Supply Estimates
Current U.S. and Canadian gas production is shown to originate from more than 300 Tcf of proven gas reserves. The North American natural gas resource base is estimated to total 4,000 Tcf when adding unproved resources to discovered-but-undeveloped gas resources. This resource base can supply U.S. and Canadian gas markets for almost 150 years at current consumption levels. The study assumes that gas supply development will continue at recently observed levels, and that there will be no new significant production restrictions (e.g., hydraulic fracturing regulations that impede supply development).
Natural Gas Demand
")
Natural gas consumption in the U.S. and Canada is projected to increase by 1.2% per year through 2035. Total natural gas use across all sectors is projected to rise to roughly 106 Bcf/d in 2035, from 80 Bcf/d in 2013. In addition, the ICF reference case projects about 9 Bcf/d of LNG exports from the U.S. and Canada, and 5 Bcf/d of pipeline exports to Mexico from the U.S. in 2035. So, total consumption for natural gas, including gas leaving the U.S. and Canada, rises to an average of 120 Bcf/d in 2035, a 1.8 % per year increase.
About 75% of the incremental demand growth within the U.S. and Canada occurs in the power sector, which is projected to account for more than one-third of total gas demand by 2035. The power sector accounts for about 30% of gas use. Most of the rest of the demand growth occurs in the industrial sector, where gas is used incrementally in petrochemical and refining operations.
Regions with the largest increase in gas use are the southeastern U.S., followed closely by northeastern and southwestern U.S. All areas exhibit significant power-generation demand growth. Canada also sees large demand growth, not only related to power generation but for oil sands production and development. When LNG exports are considered as part of the total, the southwestern United States experiences the largest increase in gas disposition because the majority of LNG exports occur from that region.
Natural Gas, NGL And Crude Oil Production
")
U.S. and Canadian natural gas production is projected to grow from an average of 83 Bcf/d in 2014 to an average of more than 120 Bcf/d in 2035, adequate to meet projected gas market needs in 2035. Unconventional natural gas supplies account for all of the incremental supply as production from conventional areas declines. Unconventional supplies (mostly shale plays) will account for about two-thirds of the total gas supply mix in 2035. Shale gas production is expected to exceed half of the total production over the next few years.
The report said U.S. and Canadian shale plays are among the world’s fastest growing production areas. The Barnett shale play has been under development for over a decade while development of the Fayetteville, Woodford, Marcellus, Haynesville, Eagle Ford, Bakken, Niobrara, Monterrey, Horn River and other shale resources began more recently but promise to contribute to the growing gas supply.
Several of these shale plays include areas with very large hydrocarbon production potential, such as the gas-rich Marcellus and Haynesville fields. Other shale plays, such as the Bakken, Eagle Ford and Niobrara, are more liquids (NGL and oil) prone. The Marcellus is projected to display the greatest growth in natural gas supply, more than doubling its current production level of about 13 Bcf/d by 2035.
Like gas production, petroleum liquids production is projected to grow in the foreseeable future. The reference case for this study projects that U.S. and Canadian crude oil and condensate production will grow from a recent level of 10 MMbpd to 18.2. More than half of the growth is from unconventional (often referred to as “tight”) oil supplies, which include production from the Bakken, Niobrara, Eagle Ford and Cline plays. In addition, the oil sands in Western Canada account for a significant portion of the growth in oil production.
NGL production is projected to roughly double by 2025, rising to about 6 MMbpd. The growth comes from a variety of shale plays, most notably the Eagle Ford, Marcellus and Western Canada plays. The growth of liquids production hinges on the development of transport capability and markets for the liquids.
Absent such development, NGL production would be stranded in a number of key areas, posing not only challenges for liquids development but for gas development as well. Natural gas pipelines require that gas transport takes place within certain tolerances for Btu content.
Thus, lack of adequate infrastructure for processing and transport of NGL eventually leads to stranded gas supplies because the gas lines will be unable to receive and transport the liquids-laden stream if they are to remain within the required tolerances.
Changes In Capacity For Natural Gas
")
New natural gas supplies entering the interstate pipeline system will require additional pipeline capacity. The base case shows that about 43 Bcf/d of incremental natural gas mainline capacity will be needed from 2014 to 2035, as shown in the pipeline capacity table. This is a modest increase of 0.2 Bcf/d per year over capacity additions in the 2011 study, which projected 1.7 Bcf/d of capacity added per year through 2035.
Regionally, the most noticeable capacity additions are out of the northeastern and southwestern states. The northeastern capacity additions are mostly driven by Marcellus and Utica gas development. The southwestern additions are driven by growth in production from the Eagle Ford and Haynesville shale plays, as well as a number of other unconventional plays.
The Southwest also is home to significant load growth, especially in the form of gas exports to Mexico and at LNG terminals, and growing petrochemical gas use. The southeastern and central states will experience significant capacity additions, mostly to deliver gas to power plants. These regions will see significant coal plant retirements, with gas-fired capacity serving as the primary replacement.
The majority of the capacity additions occur over the next decade. This coincides with the robust production and market growth that occurs during the next 5 to 10 years. After that, both production and market growth slows, with natural gas pipeline expansion slowing accordingly.
In addition to the new capacity additions, pipeline laterals will be required to connect directly to new facilities and new consumption points, and new gas processing will be needed to remove liquids and make gas suitable for pipeline transportation and downstream consumption. Those needed enhancements in the midstream sector are not reflected in the accompanying table.
The report shows the following for approximate amounts of infrastructure required for natural gas from 2011 through 2035:
• 43 Bcf/d in new gas transmission capability
• 850 miles per year in new gas transmission mainline
• 800 miles per year in new laterals to power plants, processing facilities, and storage fields
• 14,000 miles per year in new gas gathering lines
• 35 Bcf/d of new gas processing capability
• 37 Bcf per year in new working gas storage capacity;
• 580,000 horsepower per year for pipeline and gathering compression
• 9 Bcf/d of new LNG export capacity
•
Changes In Capacity For Natural Gas Liquids
")
Like natural gas pipeline capacity, pipeline capacity for NGL also will grow significantly over the next 20 years. As shown in the accompanying table, the base case projects that 3.6 MMbpd of new capacity will be needed throughout the study period. Also, like natural gas capacity, the greatest increase in capacity will occur during the next decade, coinciding with the significant production growth that occurs over the next 5 to 10 years.
Regions with the most significant increases in capacity include the central, northeastern, and southwestern U.S., which are areas in relatively close proximity to the production growth. Most of the growth results from transporting liquids from the production areas to points where new petrochemical production facilities are being built.
Additional pipeline capacity is needed to allow heavy liquids (pentanes plus) to move to Western Canada, where they can be used to enable the transportation of the relatively heavy crude being developed there. As is the case for the gas transport discussed above, the table does not include lateral capacity to connect to new facilities because that portion of midstream development.
Following are approximate amounts of NGL infrastructure required from 2011 through 2035:
• 3.6 MMbpd in new NGL transmission capacity;
• 700 miles per year in new NGL transmission line;
• 30,000 hp per year for pumping requirement for pipeline;
• 151 Mboe/d in new NGL fractionation capacity is added each year
• 64 Mboe/d in new NGL export capacity is added each year.
Changes In Capacity For Oil
")
Crude oil pipeline capacity also will increase significantly over the next 20 years. An average of 0.5 MMbpd of capacity growth is expected per year through 2035. In the United States, slightly more than 80% of crude and condensate capacity growth is expected to occur in the Midwest and Southwest to move crude oil to refineries along the Gulf Coast.
Canada also is expected to need significant amounts of new interregional capacity to export incremental oil sands production. As with natural gas and NGL capacity additions, the majority of the oil transportation additions occur over the next decade, corresponding with the large production changes that occur over the next 5 to 10 years.
Following are approximate amounts of oil infrastructure required from 2011 through 2035:
• 10 MMbpd in new oil transmission capacity
• 730 miles per year in new oil transmission line
• 35 miles per year in new laterals for crude oil storage
• 7,800 miles per year in new oil gathering lines
• 6 MMbbl per year in new crude oil storage capacity
Pipeline Investments

The accompanying table shows that more than 500,000 miles of pipeline and almost 17 million horsepower (hp) for compression and pumping capabilities will be needed for gas, NGL and oil gathering and transport throughout the projection period. Total pipeline, compression and pumping expenditures are projected at $310 billion during the period. More than 60% of the new pipe and compression will be needed for natural gas gathering and transport, with oil and NGL gathering and transport accounting for the remainder.
Pipes with a diameter greater than 24 inches will account for more than 40% of the pipeline and gathering line investments, even though they account for less than 5% of the total miles added during the study period. This is because pipes of that size have a much greater unit cost than smaller diameter pipes. Pipes with diameters less than or equal to eight inches account for the majority of new pipe mileage that is needed over time, but investment in such facilities is more modest at roughly 20% of the total investment. These smaller diameter pipes are mostly used for gathering gas, oil, and NGLs.
Regional Midstream Infrastructure Investments
Not surprisingly the largest share of regional investment in midstream infrastructure will occur in the Southwest (New Mexico, Texas, Oklahoma, Louisiana, and Arkansas), which historically has been an area of significant hydrocarbon development. Midstream infrastructure investment here is expected to total over $220 billion in the projection period. The area experiences significant investment in infrastructure, supporting development of oil, gas and liquids.
Midstream infrastructure associated with oil development accounts for almost half of the region’s investment in new midstream infrastructure. This is not surprising because more than half of the refineries in the United States are located in the area. Investment in gas-related infrastructure also is important for the region because it will be home to significant growth in gas production and load growth at petrochemical and LNG export facilities.
Canada and the central United States also are likely to experience significant investments in new midstream infrastructure as a result of the robust development of resources within those areas. These regions account for $140 billion and $110 billion, respectively, in midstream investments. Gas infrastructure investment in these areas is needed to support the growing production of shale resources and to facilitate pipeline transport to markets and export facilities.
The Northeast also is poised for midstream infrastructure growth, with investments totaling more than $80 billion through 2035. The area is home to gas-prone development from the Marcellus shale play that spurs almost $70 billion in investments in gas-related infrastructure.
Study Comparison
This study includes some investments that were not considered in the prior study. These components, which had not been previously considered, account for roughly half of the total expenditures projected in this study.
Editor’s Note: This article is based on an excerpt from the North American Midstream Infrastructure through 2035: Capitalizing on Our Energy Abundance report conducted by ICF International on behalf of the INGAA Foundation. The America’s Natural Gas Alliance was a co-sponsor of the report. For additional information or the executive summary, visit INGAA.org.

Comments