March 2014, Vol. 241 No. 3
Features
Accurate Pipeline Inspection Data Requires More Than A Pig

An often overlooked aspect of technology development in the pipeline inspection world, though one that usually turns out to be the most critical to success, is the people involved.
All of us in the oil and gas pipeline industry know about intelligent pigs. In recent years, the constant focus on the tools themselves has affected how the market looks at inline inspection (ILI). The need for operators to create a competitive, level playing field to enable purchasing departments to leverage buying power is a very understandable strategy, and has created an intense emphasis at the buying stage on the technical attributes of ILI tools.
However, the pigs are simply data collection machines, such as a body scanner, a MRI or CT scan in a medical hospital. As a patient, how interested would you be in the machine that collects your data? Would you be more interested in the specification of the machine, or in what the machine is telling the doctor, who would be someone with the ability, experience and training to make sense of the data, to identify a problem, to understand its origin, to prescribe a treatment and support you through this experience from start to finish?
Our focus will be on what a pipeline operator actually buys from an ILI vendor: the data that goes into integrity assessments and plans, which comes from the ILI report. We will discuss how it is produced, who produces it and what ingredients go into delivering accurate and reliable pipeline inspection reports.
There are many types of threats challenging the critical pipeline assets around the world: narrow axial external corrosion affects limited types of wrapped pipelines while general corrosion and pitting affect many. Geometry defects from external forces, material anomalies present since manufacture and cracking, in all its types and forms.
The challenge for ILI vendors is to optimize a technology to find all of these threats while compromising with factors such as pipeline flow speed, cleanliness, and product.
Inline Inspection Technology
Selecting the right pig for the job is a key decision. Many different technologies were developed in the last 30 years and optimized for each type of threat. Four main types of pipeline inspection tools operators may be familiar with are:
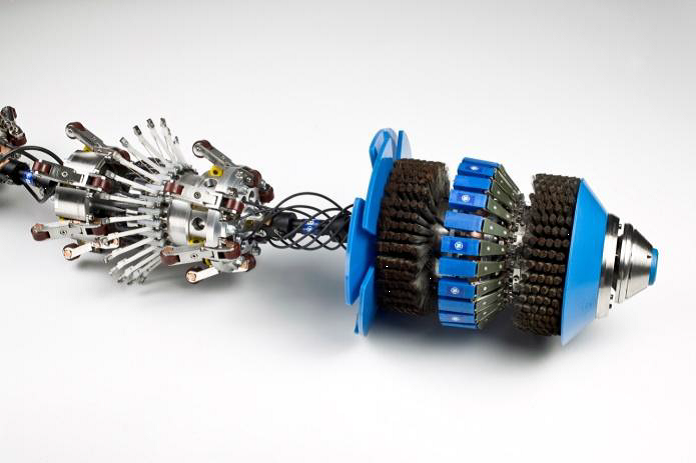
MagneScan – Magnetic-based in standalone or combination form, this is a multi-mission metal loss, geometry and mapping capable intelligent pig. Two meters long, the 14-inch MagneScan is 1 meter shorter than its predecessor, with a revolutionary electronics micro-pack and optimized tool design. It is also flexible enough to navigate tight bends and local full bore restriction. Performance is good in low-pressure gas lines as well as in pipelines rated up to 220 bar. Detection and sizing performance are maintained up to a maximum speed of 5 m/s thanks to the speed stable magnetizer. Safe operation in explosive environments is ensured by the ATEX certification of the fleet. Progressive innovative development together with close collaboration with a range of operators worldwide has taken a well-established technology to evolve into new areas of higher performance detection and characterization for pinholes and other defect types.
UltraScan CD – This tool’s mission is crack detection in liquid pipelines. Traditional piezoelectric sensors require a liquid coupling to carry the ultrasonic pulse from the sensor into the steel pipe wall. Its development began in the early 1990s, offering crack detection and location. Today, cracks can be reported in millimeter depth bands, with crack profiles, faster tool speeds, longer ranges and higher temperatures. Since entering service in 1994, the fleet has inspected more than 50,000 km of pipelines, reporting more than 1 million cracks. With a long-term proven track record, this technology’s capabilities are constantly increasing.
UltraScan DUO – Phased array sensors detect multiple defect types at the same time (cracks and loss of wall thickness) in a single run. This technology enables the creation of virtual sensors to fire ultrasonic waves at different angles. Therefore, the equipment is not reliant on a Piezo (PZ) crystal fixed at a particular angle. First introduced in 2005, this tool has inspected more than 15,000 km of pipelines and reported more than a half million cracks to date. Ongoing research is showing the possibility for the tool to find defects in more geometrically challenging areas, such as dents, thanks to the flexibility of the virtual sensors, ultimately gathering more accurate data.
EmatScan CD – The electro-magnetic acoustic transducer (EMAT) technology on inspection tools is designed to find cracks in gas pipelines. Developed over multi-generations in the last 10 years, 2008 saw the introduction of the third-generation EmatScan with probability of detection (POD) and probability of identification (POI) to match other, more traditional technologies. Multiple wave types are used to detect and discriminate defect type.
The shear horizontal wave, as an example, penetrates the pipe wall thickness and travels from the sensor position clockwise and counterclockwise in the circumferential direction around the pipe. These waves are used for crack detection and sizing. Developments in coating sensitivity, inspection range, durability and speed, as well as signal processing methods, enhanced by dig results and collaboration in the field, have enabled reliable identification and classification of defects.
Results of pipeline excavations and repair programs specifically enable such technology advances for inline inspection from virtual sensors searching for new cracks to extended detection ability and accuracy, based on collaboration with pipeline operators.
The next section will look at how we identify problems in pipelines, how we support and validate results with operators in the field, and what we do to train our people to come up with the right diagnosis.
Analysis Of Pipeline Inspection Data
In order to find the threats, in the first instance, automation of the data analysis brings repeatability, and algorithms that identify “interesting” areas or “regions of interest” (ROI). This process might flag up to 1 million ROIs on a single pipeline.
An analyst – who examines every inch of pipeline data from tool launch to receive – will spend 75% of his time scrutinizing every single ROI. As a next step, he will prioritize regions of interest and typically the original million ROIs will decrease greatly, becoming 100,000 potential defects. Finally, those prioritized features are reviewed for accuracy one by one, pixel by pixel, measured to fit with our sizing models which have been developed over 35 years and 1 million kilometers of pipeline inspection data.
To enable sound decision making and clear thinking during this process, our analysis team must know how the pipeline was built and the steel manufacturing process. The team must also know the kind of defects that can occur in a pipe mill and during pipeline construction or develop during operation.
The analysts track the direction, tie in maps and GPS points for alignment and correlate markers above the ground to locate the features precisely. They understand the pipeline, the inspection technology and how the pig should respond in this environment.
This endeavor can only be carried out with repeatable quality when backed by an intensive yearly analysis training program. Many years of listening and partnering with operators have brought higher confidence levels after each inspection, with a process in place to train, develop experience, capture feedback and learn from all findings.

Support, Validation
We have seen above how all measurement and understanding is based on a thorough knowledge of how the machine – the intelligent pig – should respond. Before an analyst sees an inspection tool, the engineering team will test and record how it behaves in different situations. Our subject matter experts will know how a particular tool operates in multiple pipe types, at different speeds, and every single analyst has access to that domain knowledge.
When it comes to remediation and repair, the analyst who made the call about a threat or a defect should be there, in the ditch. We have a long history of learning in collaboration with operators. Our customers share their findings during the dig validation process, which in turn enables us to develop new specifications, finer resolution, more accurate information and data for future inspections. For example, the new MagneScan system can detect pinholes as small as 3 mm in diameter. This breakthrough is taking the MFL principle, thought to have reached its limits, in a new direction as defects get more complex, and pipeline networks get older.
Another example in the crack detection area is also delivering additional insight. A few years ago, the UltraScan technology produced signals which looked at the pipe wall in two directions – clockwise and counter-clockwise. A crack-like signal was visible from one side, clockwise in this example, but not the other – particularly in ERW manufactured pipes.* These unusual spots were identified and through feedback from one of our partner customers, we learned to better understand the pipe welding properties. As a result, the inspection report no longer includes such features, now clearly categorized as non-threats.
People, Training
To ensure the most insightful decisions are made, we train and listen attentively. Our analysts receive f0ur to five weeks of training per year. A quality team audits reports, gathers every piece of feedback and investigates each one of them – this represents around 300 investigations per annum.
Framework guidance is provided by the pipeline industry with respect to ILI data analysis training requirements, within the standard ANSI ASNT ILI-PQ-2005. However, how this is implemented is very much a vendor choice. We choose to implement it in a rigorous way. Each of our training courses is followed by a testing skills assessment, independently reviewed for a pass or fail.
In addition to passing an assessment, analysts must demonstrate competency within the team. An analysis experience record is kept for each task. Individuals are assessed by peers and supervisors to demonstrate their ability to apply the learning in practice to the group. Their work will then regularly be audited. Finally, medical aptitude for optical vision is also tested.
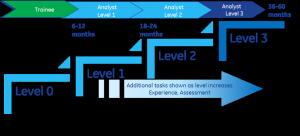
It takes time to develop this level of experience and unique skill. As an industry, we need to protect this human investment: we collectively have more than 1,200 years of experience within the PII Analysis team, which is difficult to replace. We have designed an analysis career path structured around the technology training, assessment and experience for our team’s development.
It is important to attract good people, develop their skills and retain them to reach their full potential: it takes five years to reach Level 3 certification for UltraScan technology analysis, for example.
Conclusions
Inline inspection is more than a “pig run.” Turning the base data collected by the machine into the information that is needed as the input to integrity assessments and planned responses for pipeline operators is the ultimate deliverable.
ILI technology is truly amazing:
• running at 9 mph
• taking 1.2 M measurements per second
• examining the equivalent surface of 70 soccer pitches, and
• analyzing 100,000 potential defects, on 20,000 screens of data.
Operators can see technology advances in the specification sheets and ongoing collaboration with ILI vendors creates confidence. People and processes turn this technology into reality, as the key to accurate and reliable data for input into pipeline integrity plans.
*ERW manufactured pipes in which the weld is created by electric resistance method, squeezed together at the seam with the flash excess material trimmed off by a mechanical planning process.
Author: Paul Mallaburn is GE’s global analysis manager based in Cramlington, UK.
He joined the company in 199, and has positions as data analysis manager, planning leader and most recently project manager and operation leader in the Integrity Services Threatscan team. Mallaburn holds a bachelor of science degree in computer and systems engineering and an master’s degree from the University of Northumbria.


Comments