
March 2014, Vol. 241 No. 3
Features
BP: Global Energy Demand Growth Slowing, Despite Increases Driven By Emerging Economies
Global energy demand continues to grow but that growth is slowing and mainly driven by emerging economies – led by China and India – according to the BP Energy Outlook 2035.
This is the fourth annual edition of the Outlook which for the first time sets out BP’s view of the most likely developments in global energy markets further beyond 2030- 2035, based on up-to-date analysis.
The Outlook reveals that global energy consumption is expected to rise by 41% from 2012-2035 – compared to 55% over the last 23 years and 30% over the last 10. About 95% of that growth in demand is expected to come from the emerging economies while energy use in the advanced economies of North America, Europe and Asia as a group is expected to grow only very slowly – and begin to decline in the later years of the forecast period.
The report shows shares of the major fossil fuels are converging with oil, natural gas and coal each expected to make up around 27% of the total mix by 2035 and the remaining share coming from nuclear, hydroelectricity and renewables. Among fossil fuels, gas is growing fastest, increasingly being used as a cleaner alternative to coal for power generation as well as in other sectors.
Bob Dudley, BP Group Chief Executive, said the Outlook “highlights the power of competition and market forces in unlocking technology and innovation to meet the world’s energy needs. These factors make us optimistic for the world’s energy future.”
Dudley added: “The Outlook leads us to three big questions: Is there enough energy to meet growing demand? Can we meet demand reliably? And what are the consequences of meeting demand? In other words, is the supply sufficient, secure and sustainable?”
“On the first question, our answer is a resounding ‘yes’. The growth rate for global demand is slower than what we have seen in previous decades, largely as a result of increasing energy efficiency. Trends in global technology, investment and policy leave us confident that production will be able to keep pace. New energy forms such as shale gas, tight oil, and renewables will account for a significant share of the growth in global supply.”
On the question of security, the Outlook offers a mixed, though broadly positive, view. Among energy importers, the United States is on a path to achieve energy self-sufficiency* while import dependence in Europe, China and India will increase. Asia is expected to become the dominant energy-importing region. Dudley noted: “This need not be a cause for concern if the market is allowed to do its work, with new supply chains opening up to these big consuming regions.”
On the question of sustainability, global carbon dioxide emissions are projected to rise by 29%, with all of the growth coming from the emerging economies. The Outlook notes some positive signs: emissions growth is expected to slow as natural gas and renewables gain market share from coal and oil; and emissions are expected to decline in Europe and the U.S. Toward the end of the period covered by the Outlook it is expected many advanced countries will be seeing their economies grow while their energy use falls.
BP Chief Economist Christof Rühl said: “This process shows the power of economic forces and competition. Put simply, people are finding ways to use energy more efficiently because it saves them money. This is also good for the environment – the less energy we use the less carbon we emit. For example, CO2 emissions in the U.S. are back at 1990s’ levels.”
This year’s edition examines transportation more closely and offers an in-depth look at the North American natural gas revolution.
Primary Energy
The Outlook shows global energy demand continuing to increase at an average of 1.5% a year to 2035. Growth is expected to moderate over this period, climbing at an average of 2% a year to 2020 and then by only 1.2% a year to 2035. Nearly all of this growth is expected to come from non-OECD economies, with China and India accounting for more than half of the increase. By 2035, energy use in the non-OECD economies is expected to be 69% higher than in 2012. In comparison, use in the OECD will have grown by only 5%, and actually to have fallen after 2030, even with continued economic growth.
While the fuel mix is evolving, fossil fuels will continue to be dominant. Oil, gas and coal are expected to converge on market shares of 26-27% each by 2035, and non-fossil fuels – nuclear, hydro and renewables – on a share of around 5-7% each.
Oil
Oil is expected to be the slowest growing of the major fuels to 2035, with demand growing at an average of 0.8% a year. This will still result in demand for oil and other liquid fuels being nearly 19 million bpd higher in 2035 than 2012. All the net demand growth is expected to come from outside the OECD – demand growth from China, India and the Middle East will together account for almost all of net demand growth.
Growth in the supply of oil and other liquids (including biofuels) to 2035 is expected to come mainly from the Americas and Middle East. More than half of the growth will come from non-OPEC sources, with rising production from U.S. tight oil, Canadian oil sands, Brazilian deepwater and biofuels more than offsetting mature declines elsewhere. Increasing production from new tight oil resources is expected to result in the U.S. overtaking Saudi Arabia to become the world’s largest producer of liquids in 2014. U.S. oil imports are expected to fall nearly 75% between 2012-2035.
OPEC’s share of the oil market is expected to fall early in the period, reflecting growing non-OPEC production together with slowing demand growth due to high prices and increasingly efficient transport technologies. OPEC market share is expected to rebound somewhat after 2020.
Gas
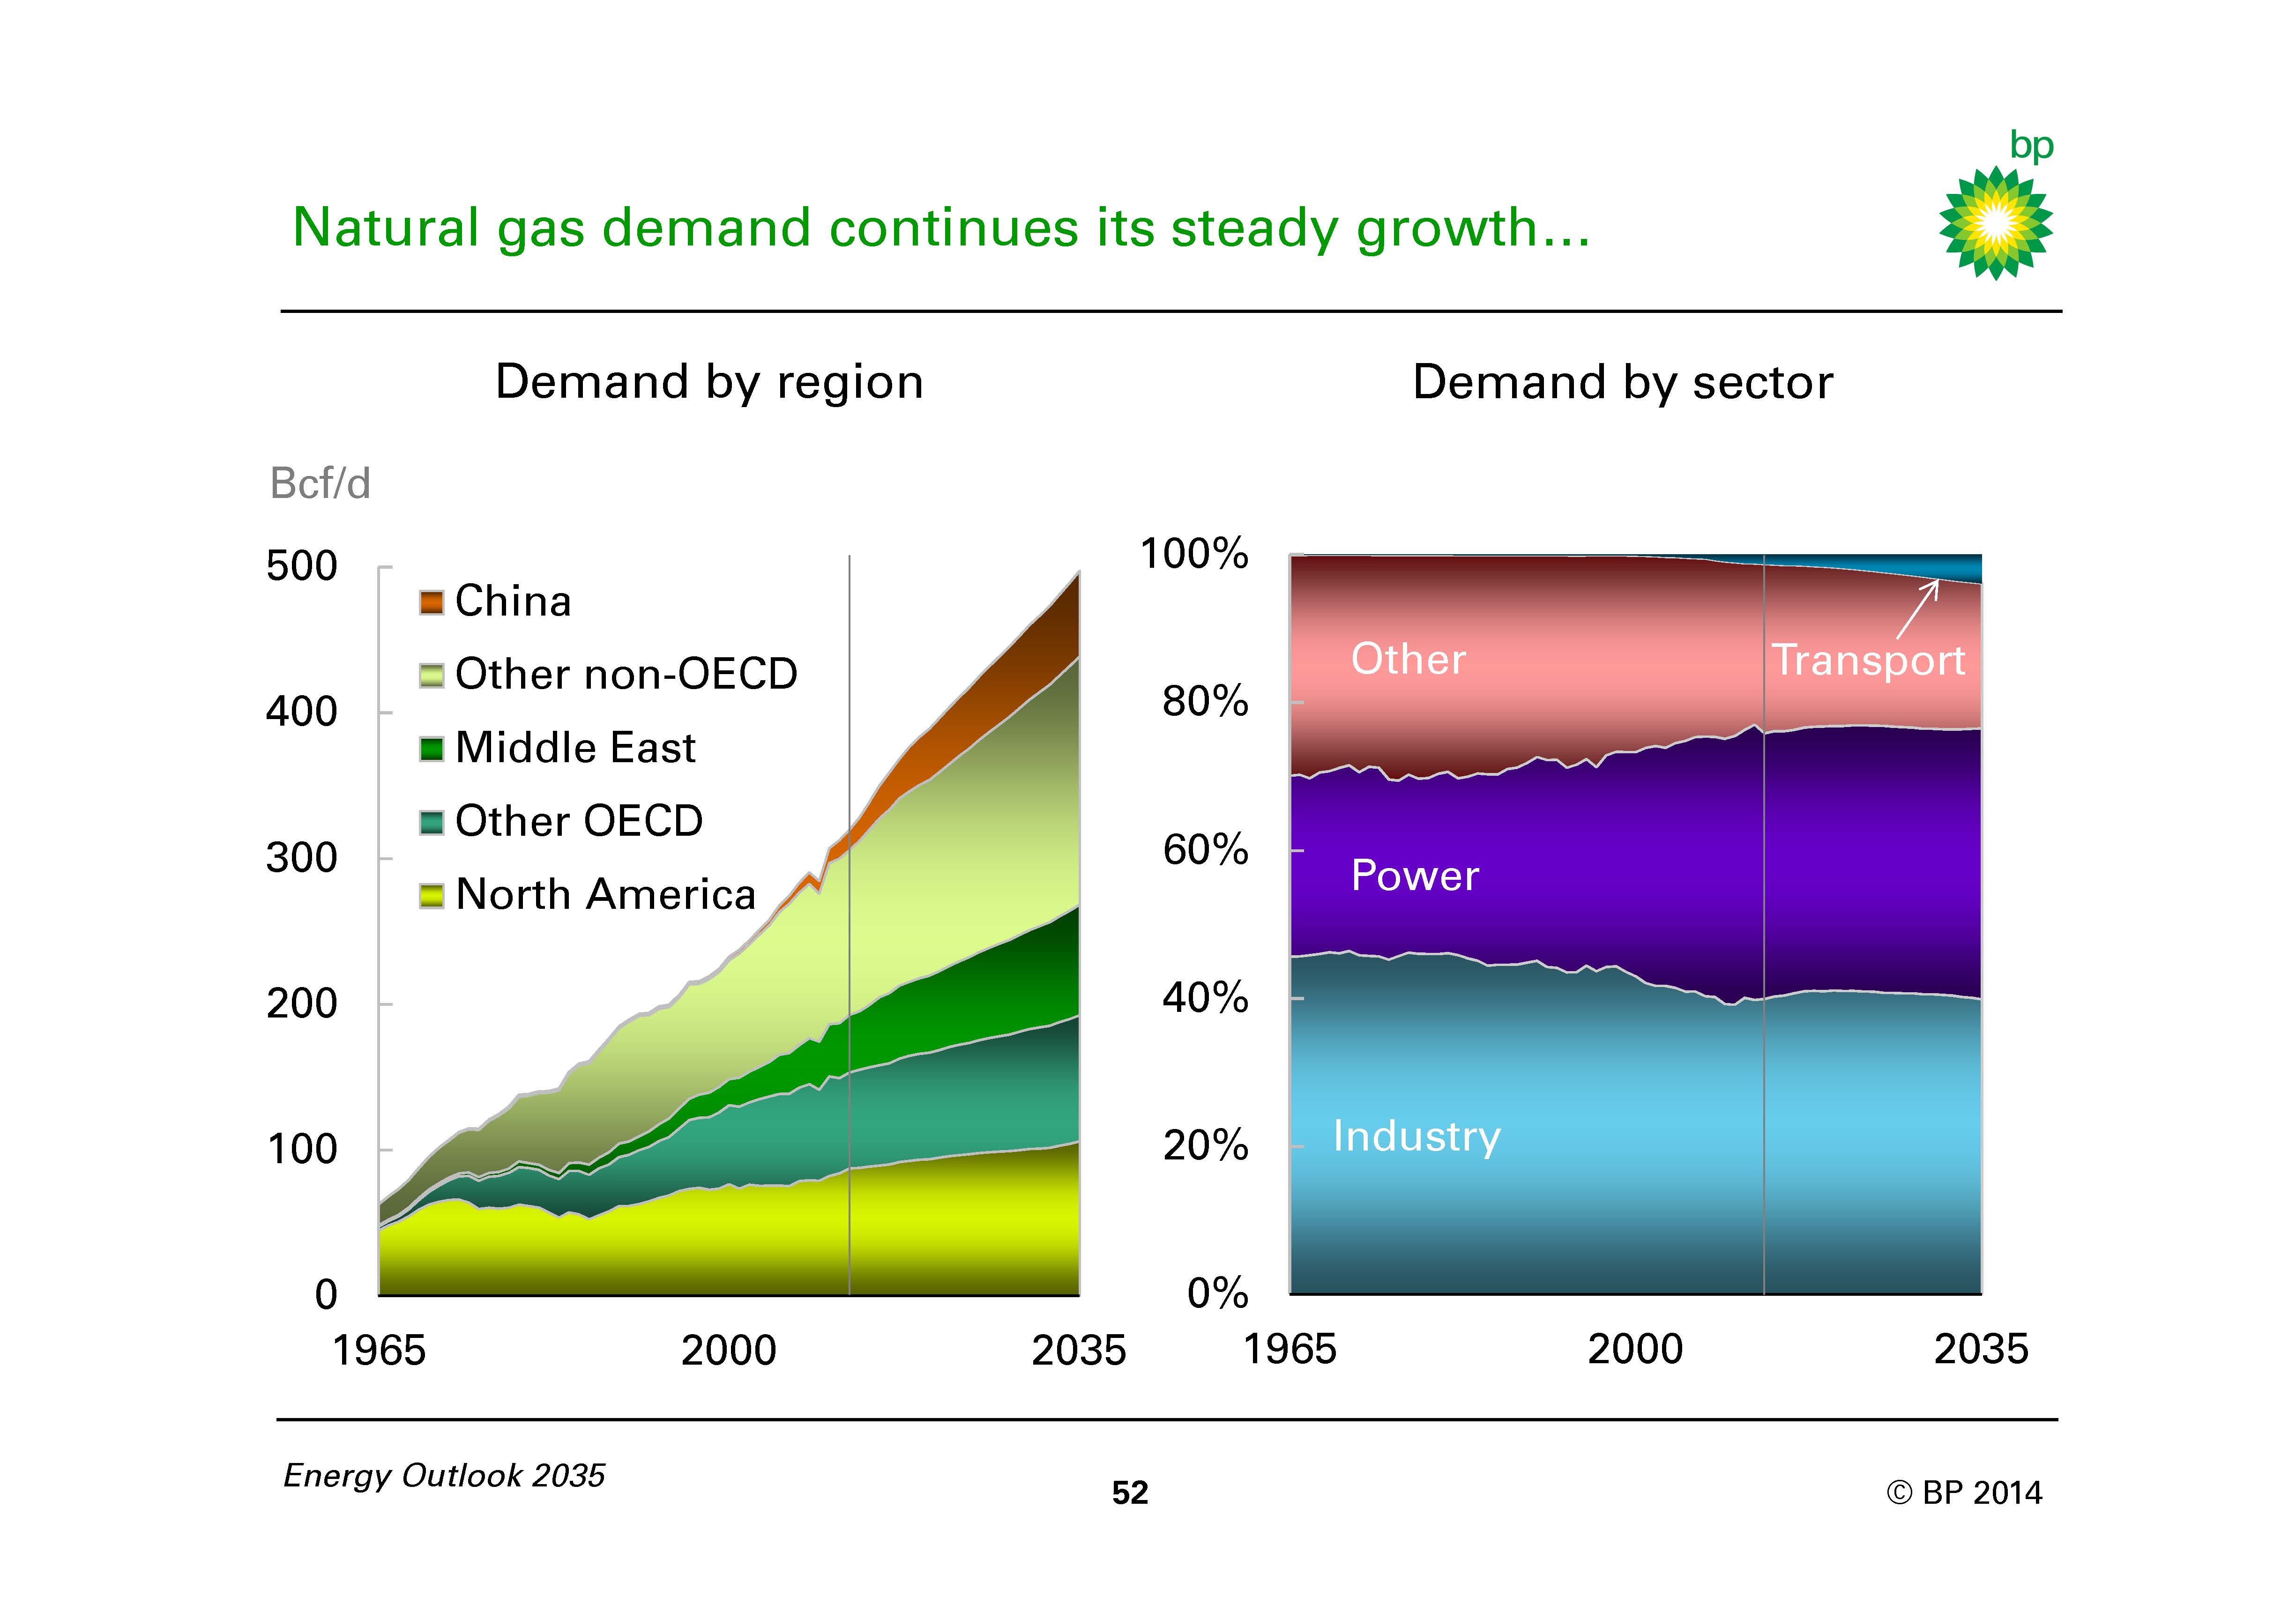
Natural gas is expected to be the fastest growing of the fossil fuels – with demand rising at an average of 1.9% a year. Non-OECD countries are expected to generate 78% of demand growth. Industry and power generation account for the largest increments to demand by sector. LNG exports are expected to grow more than twice as fast as gas consumption, at an average of 3.9% per year, and accounting for 26% of the growth in global gas supply to 2035.
Shale gas supplies are expected to meet 46% of the growth in gas demand and account for 21% of world gas and 68% of U.S. gas production by 2035. North American shale gas production growth is expected to slow after 2020 and production from other regions to increase, but in 2035 North America is still expected to account for 71% of world shale gas production.
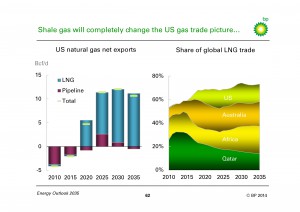
Perhaps the most dramatic adjustments to shale gas are seen in trade flows. The U.S. is set to shift from a net importer of gas today to a net exporter in 2018, with net exports reaching 10.6 Bcf/d by 2035. It will become a net LNG exporter from 2016, reaching a total net LNG export volume of 11.2 Bcf/d by 2035.
The arrival of U.S. LNG exports at scale has a profound impact on global LNG markets, contributing to a shake-up in the structure of LNG supplies. Australia is set to overtake Qatar as the largest LNG-exporting country by 2019, followed by the U.S. overtaking Qatar in 2030. And Africa as a region is likely to overtake the Middle East.
Increasing diversification of LNG supply sources supports the globalization of the gas market. Australia is expected to be the largest LNG exporter in 2035 with a share of 21% of global LNG trade; that compares to a share of 32% held by the dominant supplier today, Qatar.
Coal
After oil, coal is expected to be the slowest growing major fuel, with demand rising on average 1.1% a year to 2035. Over the period, growth flattens to just 0.6% a year after 2020. Nearly all (87%) of the net growth in demand to 2035 is expected to come from just China and India, whose combined share of global coal consumption will rise from 58% in 2012 to 64% in 2035.
Other
Nuclear energy output is expected to rise to 2035 at around 1.9% a year. China, India and Russia will account for 96% of the global growth in nuclear power while nuclear output in the U.S. and EU declines due to expected plant closures.
The growth in hydroelectric power is expected to moderate to 1.8% a year to 2035, with nearly half of the growth coming from China, India and Brazil.
Renewables are expected to be the fastest growing class of energy, gaining market share from a small base as they rise at an average of 6.4% a year to 2035. Renewables’ share of global electricity production is expected to grow from 5% to 14% by 2035. While the OECD economies have led in renewables growth, renewables in the non-OECD are catching up and are expected to account for 45% of the total by 2035. Including biofuels, renewables are expected to have a higher share of primary energy than nuclear by 2025
Editor’s Note: The BP Energy Outlook 2035 is available online at www.bp.com/energyoutlook.
?
U.S. Energy Self Sufficiency By 2035
By 2035, BP projects the U.S. will be energy self-sufficient while maintaining its position as the world’s top liquids and natural gas producer. Some of the reasons given in the report are:
• U.S. energy production rises by 24% while consumption expands by just 3%.
• Large declines in oil (-18%), coal (-12%), and nuclear (-17%) demand are more than offset by consumption growth in natural gas (+21%) and renewables in power (+277%).
• With large declines in oil and coal consumption, U.S. CO2 emissions from energy use decline by 6% to levels not realized since the late 1980s.
• Natural gas replaces oil as the leading fuel in U.S. energy consumption around 2027 – rising from 30% today to 35% in 2035. Oil’s share falls from 36% to 29%.
• Fossil fuels still account for 80% of U.S. energy demand in 2035, down from today’s 85%, driven by the increase of renewables in power generation from 2% to 8%.
• Energy consumed in power generation rises by 10% and while coal remains the dominant fuel source, its share drops from 43% to 35%.
• Energy consumed in transport falls by 18%. Oil remains the dominant fuel source, but its share falls from 95% to 83% as both biofuels and natural gas capture an 8% share by 2035.
• U.S. energy production as a share of consumption rises from 84% in 2012 to 101% in 2035.
• Rising US production of oil (+37%) and natural gas (+45%) outpace declines in coal (-20%). Oil output will surpass its previous peak (1970) while natural gas continues to rise from today’s record levels.
• U.S. tight oil output will triple to 4.5 Mb/d in 2035, accounting for a third of liquids production. Shale gas production should more than double to 65 Bcf/d, reaching nearly 70% of the total.
• With large increases in oil and natural gas production U.S. oil imports drop by nearly 75% to the lowest level on record and the country becomes a net exporter of natural gas by 2017.
• US share of global demand falls from 18% to 13% in 2035 as China rises from 22% to 27%, having passed the US in 2010 as the largest consumer.
• The U.S. will remain the world’s largest producer of natural gas, accounting for nearly 20% in 2035. The U.S. will also be the world’s largest liquids producer starting in 2013.
• U.S. energy intensity will be 40% lower in 2035, falling faster than the global average of 36%. Per capita energy use will be the lowest on record.

Comments