
December 2012, Vol. 239 No. 12
Features
New Ideas In DP Flow Measurement Using Cone Meter Technology
Flow measurement technology is advancing at an ever-increasing rate. New engineering methods in the art of flow measurement are forcing a change for the better. Newer technologies often bring advances to the operational processes within many industries which can improve management and production. This article details the design and operation of a new genre of differential pressure (DP) cone meter.
Generic Cone Meter Overview (Original Invention). A typical cone meter consists of a differential producer fixed concentrically in the center of the pressure retaining pipe by which a differential pressure can be obtained across the interface of two cone frustums via an internal port-way system.
This allows the downstream pressure, P2, to be measured in the center of the closed conduit. The upstream pressure, P1, measured at the pipe wall. (Figure 1)

Figure 1: Generic cone meter
Welded Fabrication (Generic Meters). The aforementioned generic design (Figure 1) is fabricated from steel pipe and flanges with a cone set on a cantilever support. This method of construction – while it can be robust – may experience issues regarding cone concentricity and each manufactured meter usually requires a calibration, the differential pressure cone and beta ratio is generally fixed and not interchangeable.
The concept of using the center of the cone above to collect the downstream pressure has certain advantages over conventional differential pressure devices such as the following: a) flow conditioning; b) large turndown; c) static mixing (certain beta ratios).
Generic Cone Meter Calibrations. The common mode for checking that generic cone meters are manufactured/functioning correctly is to calibrate each device over the Reynolds number (ReD) at which it will operate usually by the manufacturer or a third-party test house.
This is great if the in-field ReD numbers can be reached by the laboratory calibrating the device. However, these calibrations have usually been managed in a “water flow laboratory” which may not achieve the desired flow range-ability. This means in order to test a welded-type cone meter properly, it should be calibrated on an equivalent in-field Reynolds number range. This gas testing may be costly to provide per meter manufactured.
The advantage, however, is that the meter should have the correct coefficient of discharge (Cd) with this methodology.
Law of Similarity. This is a concept used in the design and testing of engineering models and is heavily used in aerospace and aircraft design.
A model is said to have similitude with the real application if the two applications share geometric similarity, kinematic similarity and dynamic similarity, as follows: 1) geometric similarity – the engineered model is the same shape as the application, but usually scaled; 2) kinematic similarity – fluid flow of both the model and real application must undergo similar time rates of change motions – (fluid streamlines are similar); and 3) dynamic similarity – ratios of all forces acting on corresponding fluid particles and boundary surfaces in the two systems are constant.
A recent API standard concluded the acceptability of the geometric similitude method for type-testing acceptance in the scaling up or down for meter geometries, et al. See “MPMS API Chapter 22.2 Differential Pressure Test Protocol 2005.”
The idea is based on the testing of various meter diameters with the same geometric shape to type test a meter. This does not – emphasis on “not” – relinquish the need to properly calibrate metering devices that are dependent on external Cd determination by laboratory calibration (due to manufacturing differences between devices) but is intended to give confidence to a manufacturer’s claim of fidelity over conditions of operation expected for the in-field condition.
Some cone meter manufacturers have begun to have their DP devices verified according to this API 22.2 standard and can show independent data to confirm claims about the performance of their devices in a field condition.
Manufacturing Identical Flow Meters. The previous comment on similitude is valid only if the models have identical manufacturing parameters and scaled geometries with tolerances that are realistic in nature.
A New Idea. One cone meter manufacturer has taken the concept of geometric similitude seriously by using computer numerical control (CNC) – machined castings or forgings to develop a range of devices that have inherent repeatability in the meter tube, housings and primary elements.
Some of the major issues in the manufacture of identical cone type meters are the concentricity of the DP cone element, the repeatability of the attachment method (cantilever), and the definition of surface roughness in the throat of the meter.
The use of an accurately machined meter housing (casting or forging) incorporating a machined cantilever cone support should satisfy geometric similitude and also enable congruent results between a meter’s throat internal diameter and cone elements’ roundness for each subsequent production device manufactured.

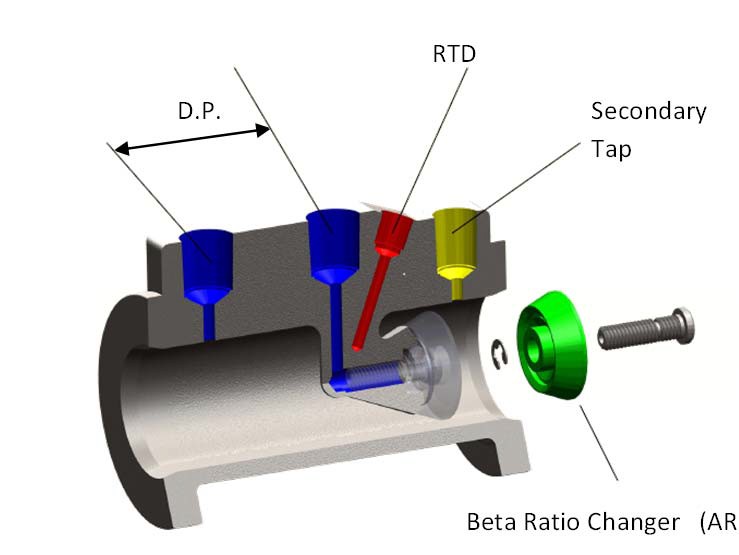
Figure 2: Artifact-calibrated cone meter design
This manufacturer has also developed a unique way to enable beta ratio changing by using a removable CNC-machined “area ratio changer” (ARC) separate cone section to effectively enhance the meter’s range-ability by allowing the differential producer element diameter to be varied according to the required flow rate range (Figure 2).
Artifact-Calibrated Meters. The standardized orifice plate flow meter is an artifact-calibrated metering system using a proven pre-determined geometry per pipe diameter and similitude (law of similarity) for the location of the plate, orifice size, surface roughness, tap position and tap geometry. Also relevant is the position in the pipe and location in the meter tube with concentricity taken into account.
If any of these parameters are skewed, the orifice calculation (which is based on the original artifacts or test meters used to determine data sets used in national and international orifice standards) will be wrong.
The idea regarding the cone meter is also intended to develop an artifact-calibrated system methodology that similarly uses geometry, manufacturing stability and repeatability to obtain similitude between devices of the same meter diameter.
This concept had tremendous advantages over previous executions of cone meter devices. These can be listed as follows: 1) calibration traits of the artifacts (original prototypes) transferred to the meter (provided that the CNC-machining tolerances and body dimensions are valid between devices) offering minimum dynamic calibration; 2) meter turndown can be determined after manufacture to suit the application and controlled (this will be discussed later in this article); 3) concentricity of the meter and subsequent area ratio (beta) changers controlled at a high tolerance level; 4) tap design, position and repeatability of design; and finally 5) surface roughness control by CNC machining – very important for dynamic and kinematic similarity.
All the above are major parameters needed in the fight to achieve a mechanically repeatable cone meter that may offer good consistent performance between subsequent units.
Calibration and Range-ability (DP Meters). After a meter that has the traits previously mentioned is manufactured, the operation can be defined to obtain the optimum range-ability vs. uncertainty over that range.
In the past, generic cone meter designs with fixed betas have performance claims by manufacturers in the region of 10-1 turndown encompassing a Cd linearity shift that can change in certain regions of the Reynolds number/flow rate range. This effect of change has been seen in many other different DP meter types also.
The use of an interchangeable cone or area ratio changer (ARC) can really help a meter application when the flow rate of a well has declined and the meter needs to be re-ranged while providing the optimum DP range across the differential producer cone. Changing out the differential producer can adjust the range and bring it back to a useable number while re-affirming the performance/uncertainty by operating the device in the linear part of its calibration curve.
While the orifice plate has a good performance if installed correctly, the upstream install condition, flow condition and flatness profile is important for the meter uncertainty to be acceptable.
A big advantage that an artifact-calibrated cone meter can provide is the improved immunity to disturbed flow profile effects. It is known and has been physically demonstrated that a cone meter’s (generic or artifact device) centrally mounted element distributes the velocity profile to the meter internal wall or throat region. When you add this fact to a device that has a CNC-machined construction, the performance and closeness of discharge coefficients between subsequent production run meters is much improved.
The application or control of range-ability can be superior to other fixed design cone meter devices because the device’s area ratio can be changed to suit the operating flow rate. Data comparisons show enhanced range-ability for such CNC-machined devices vs. generic welded and non-machined single beta ratio-designed cone meters.
Typical Welded Cone Meters. The coefficient of discharge curve shown next is for a fabricated welded generic design. The differences between the Cds per subsequent production meters can be up to 5-7%, thus it’s important to keep the manufacturing tolerance and surface roughness tolerances tight which is difficult to execute with a welded assembly.
Figure 3: 2-inch generic cone meter (welded) tested 2009 et al. Davis & Lawrence (0.45 beta).
The calibrated points show good resistance to disturbance issues upstream as do most cone-type meters as the base line for this meter and all disturbance parameters fall within +/-0.5% at each point. If this 2-inch meter were to be used with the point inputted into a flow computer, the performance would be very good, noting that stacked transmitters were used. One cautionary issue is that of the calibrated Reynolds number (ReD) ranges.
As previously mentioned, the normal situation regarding welded generic cone-type meters is to calibrate each one to overcome geometric similarity issues. If the test loop uses a water medium, the high ReD range is limited to a velocity achievable in the medium (water as opposed to gas).
It is preferable to test these meters with similar viscosities and Reynolds numbers (ReDs) to obtain a useable Cd in the correct operating flow range
Test Loop Flow Ranges. An example is shown in Figure 4 highlighting a calibration range issue. This shows a typical generic meter test report with flows over a large range based on air and water. A water rig cannot reach the high ReDs seen in an air rig; therefore, it may be difficult to fix the true Cd points with good certitude above the limit of the water rig for some flow rates. The testing at the maximum water flow range can be seen to be well below the gas/air test lab range-ability.
Figure 4: Typical flow (ReD) ranges (water vs. an air rig)
Artifact-Calibrated Meters. The use of interchangeable artifact-calibrated beta/area ratio changers (ARCs) opens up the possibility of using the meter in the field application with a certain size of beta and then – as the field condition changes over time – a different ARC (beta) element could be installed, thus reducing the need to change out an old meter for a new one, which may even cause pipe diameter changes to be necessary as a well’s flow declines.
Figure 5 shows a 2-inch artifact calibrated device with three beta ratios plotted on the one calibration chart. This shows that you can tighten up the uncertainty over the Reynolds number ranges by doing a change of area at the bottom range of each ARC (beta). (Since this testing, further testing is being done to confirm the use of the meter to 400 inches water column)
This improves the cone-meter linearity and performance by negating the drop at the low red range, extending the linear range from the high to the low without a pre-determined calibration. Thus Geometric, Dynamic and Kinematic Similarity is satisfied by the precision machining and manufacturing process.
If further proof of concept is needed, sample production devices can be taken at random from the manufacturing process and proof-tested for that manufactured batch. Therefore, spreading the air/gas calibration cost over a few units is an economical check method to provide the proof of application.
Figure 5: Calibration ranges for different ARCs (betas) 2-inch meter
The meter in Figure 5 has very good linearity for each beta changer (ARC). The data show the average C.d. is constant over +/- 0.5% between ranges of 375,000 to 76,000 ReD for the largest beta ratio changer or (ARC) 0.41 beta, from 597,000 to 115,000 ReD for the mid-size ARC @0.52 beta ratio and a range of 863,000 to 156,000 ReD for the smallest diameter ARC tested at 0.61 beta.
The real advantage for this type of ARC type meter is that you can operate the meter at its optimum DP throughout the gas well’s life and also help to reduce transmitter uncertainties at the lower DPs which may occur as a well depletes, provided the transmitter is used is sized correctly.
Thus each meter can be re-ranged using a specific ARC that has inherent accuracy over a predetermined and defined range by dimensional geometric comparison with the original gas-tested artifacts which is a means to ensure accurate Cds are maintained.
The following independent data is from API 22.1 testing that was performed at the CEESI facility in 2011. The flow perturbation effects test on the meter can be seen graphically in the next figures.
Figure 6: 0.41 beta base line with superimposed out of plane elbows testing (blue) @ 5Ds
Figure 7: 0.52 beta base line with superimposed out of plane elbows testing (blue) @ 5Ds
Figure 8: 0.61 beta base line with superimposed out of plane elbows testing (blue) @ 5Ds
Conclusion
From the research data that has been produced over 35 years regarding cone-meter type devices it seems that claims regarding the robustness of its perturbation resistance are well-founded and – providing that a proper calibration is performed – their use in custody transfer measurement is not an issue.
The calibration as pointed out must be on equivalent Reynolds number ranges unless the device can repeatedly demonstrate geometric similarity and machined accuracy between subsequently manufactured devices, thus allowing artifact principles to be applied.
The use of artifact calibration techniques and control of the manufacturing process may be a key driver in the next evolution of these meter types.
Control of surface roughness and machining a meter together with tight quality control in the dimensional tolerance appear to enhance these meter types’ performance. This also has an effect on the energy efficiency/recovery across the meter; Cds of circa>+0.92 have rarely been seen with cone-type meters.
It will be interesting to see future data sets for meters using an artifact-calibration principle in wet gas systems and how the changing beta ratios in the same body will help in these application types.
Author
Philip A. Lawrence, M.Inst.M.C.,is Vice President (Technical Sales), Dynamic Flow Computers Inc., Stafford, TX. He is the Chairman of ISO TC193 Sc3 Natural Gas Standards Committee (Upstream Area). He has worked in the oil and gas industry for 30 years and has two patents granted for flow metering and related devices. He is a member of the Institute of Measurement and Control in the UK, and also works within in the API as a committee member and lead on the Committee on Production Measurement & Allocation. (CPMA) Contact: +1-281-924-3258.
Recent Author Publications
Testing of Differential Pressure Cone Type Flow Meters to Various International Standards – 8th International Flow Measurement Conference Colorado Springs (CEESI) – June 2012.
The Effect of Geometry on Differential Pressure Meter Performance Zanker & Lawrence, The Americas Flow Measurement Workshop Houston 2011.
Lawrence/Dr.Sung, (Hitrol & Cameron), API 22.2 testing Part 1 IFFS Alaska 2009/
Lawrence/Davis (Shell E&P & Cameron), Field Comparison of a 4 Holed Orifice Plate and a Cone Meter IFFS 2009.
Biographical References
1) The Effect of Geometry on Differential Pressure Meter Performance Zanker-Lawrence, The Americas Flow Measurement Workshop Houston 2011.
2) Stewart D., Reader Harris M., Peters R., “Derivation of an Expansibility Factor for the V-Cone Meter,” Flow Measurement International Conference, Peebles, Scotland, UK, June 2001.
3) Hodges, Britton, Johansen & Steven 15th Flow Measurement Conference (FLOMEKO) Cone DP Meter Calibration Issues 2010.
4) Lawrence /Sung HITROL & CAMERON , API 22.2 testing Part 1 IFFS 2009 .
5) Lawrence /Davis Field Comparison of a 4-Holed Orifice Plate and Cone Meter IFFS 2009.
6) Peters, Bowles & George NSFMW – 2004 API testing to chapter 5.7 (now 22.2).
7) CEESI – Expansibility coefficient derivation for a Dynamic Smart-Cone™ 2011.
8) CEESI API 22.2 Data set for Dynamic Flow Computers USA June Release 2012.

Comments