November 2012, Vol. 239 No. 11
Features
Recent Innovations In Seam Weld Integrity Assessment
Governmental bodies are paying particular attention to seam welded pipes because several prominent releases, including the PG&E San Bruno, CA explosion, occurred at longitudinal seams.
There was much discussion during 2011 of the seam weld issue by various parties, including state and local government agencies, pipeline operators, industry organizations and consultants. Some have advocated for a large influx of research funding to address the perceived gaps in technology. However, in a number of cases the necessary technology already exists, so further R&D might result in reinventing the wheel.
For example, the pipeline industry relies on flaw assessment methods that are over 30 years old, but improved models are available. There have since been significant advances in fracture mechanics, fitness-for-service assessment and remaining life models. The pipeline industry can benefit by adopting methodologies that have been successfully applied in other industries, including oil and gas production, refinery, chemical, petrochemical and power generation.
This article presents a sample of innovative technology that can be applied to the integrity management of seam-welded pipe. The focus is on cracks and other planar flaws, but innovative approaches for other anomaly types are also available.
Can a “conservative” approach be unsafe? Although many pipeline operators are open to innovations in integrity management, some adopt the attitude of “if it ain’t broke, don’t fix it.” One of the most common arguments against using advanced flaw assessment methods is that the traditional approaches are “conservative,” in that they tend to underestimate burst pressure and critical flaw size. There are at least two counter arguments to this point of view:
1. When a “conservative” failure model is used in conjunction with a hydrostatic test, the simplified model underestimates the maximum flaw size that could have survived the test. As a result, larger-than-expected flaws are often left in the pipe after a hydrostatic test. Since large cracks grow faster than small cracks, the “conservative” approach can overestimate remaining life. Using a supposedly conservative model in reverse is analogous to looking through the wrong end of a telescope.
2. When a “conservative” flaw assessment model is used make decisions on digs and repairs, a large number of anomalies are remediated unnecessarily. This would not be a problem if integrity budgets were infinite. However, funds spent on unnecessary repairs are not available to address real areas of concern.
The first point was addressed in a 2010 PPIM paper (literature ref. on request). The second argument is explored in more detail here.
Given a pipeline that contains a number of anomalies, there are four possible outcomes for each anomaly (These terms are traditionally used with respect to flaw detection, but the present meaning is different. In the present case, the terminology of true positive, false positive, etc. pertains to the decision on whether or not to remediate a particular anomaly.):
True Positive – An anomaly that poses a risk is remediated.
True Negative – Action on an anomaly that does not pose an immediate risk is deferred.
False Positive – An anomaly that does not pose an immediate risk is remediated.
False Negative – No action is taken on an anomaly that poses a risk, either because it is not detected by ILI or because inaction is a conscious decision.
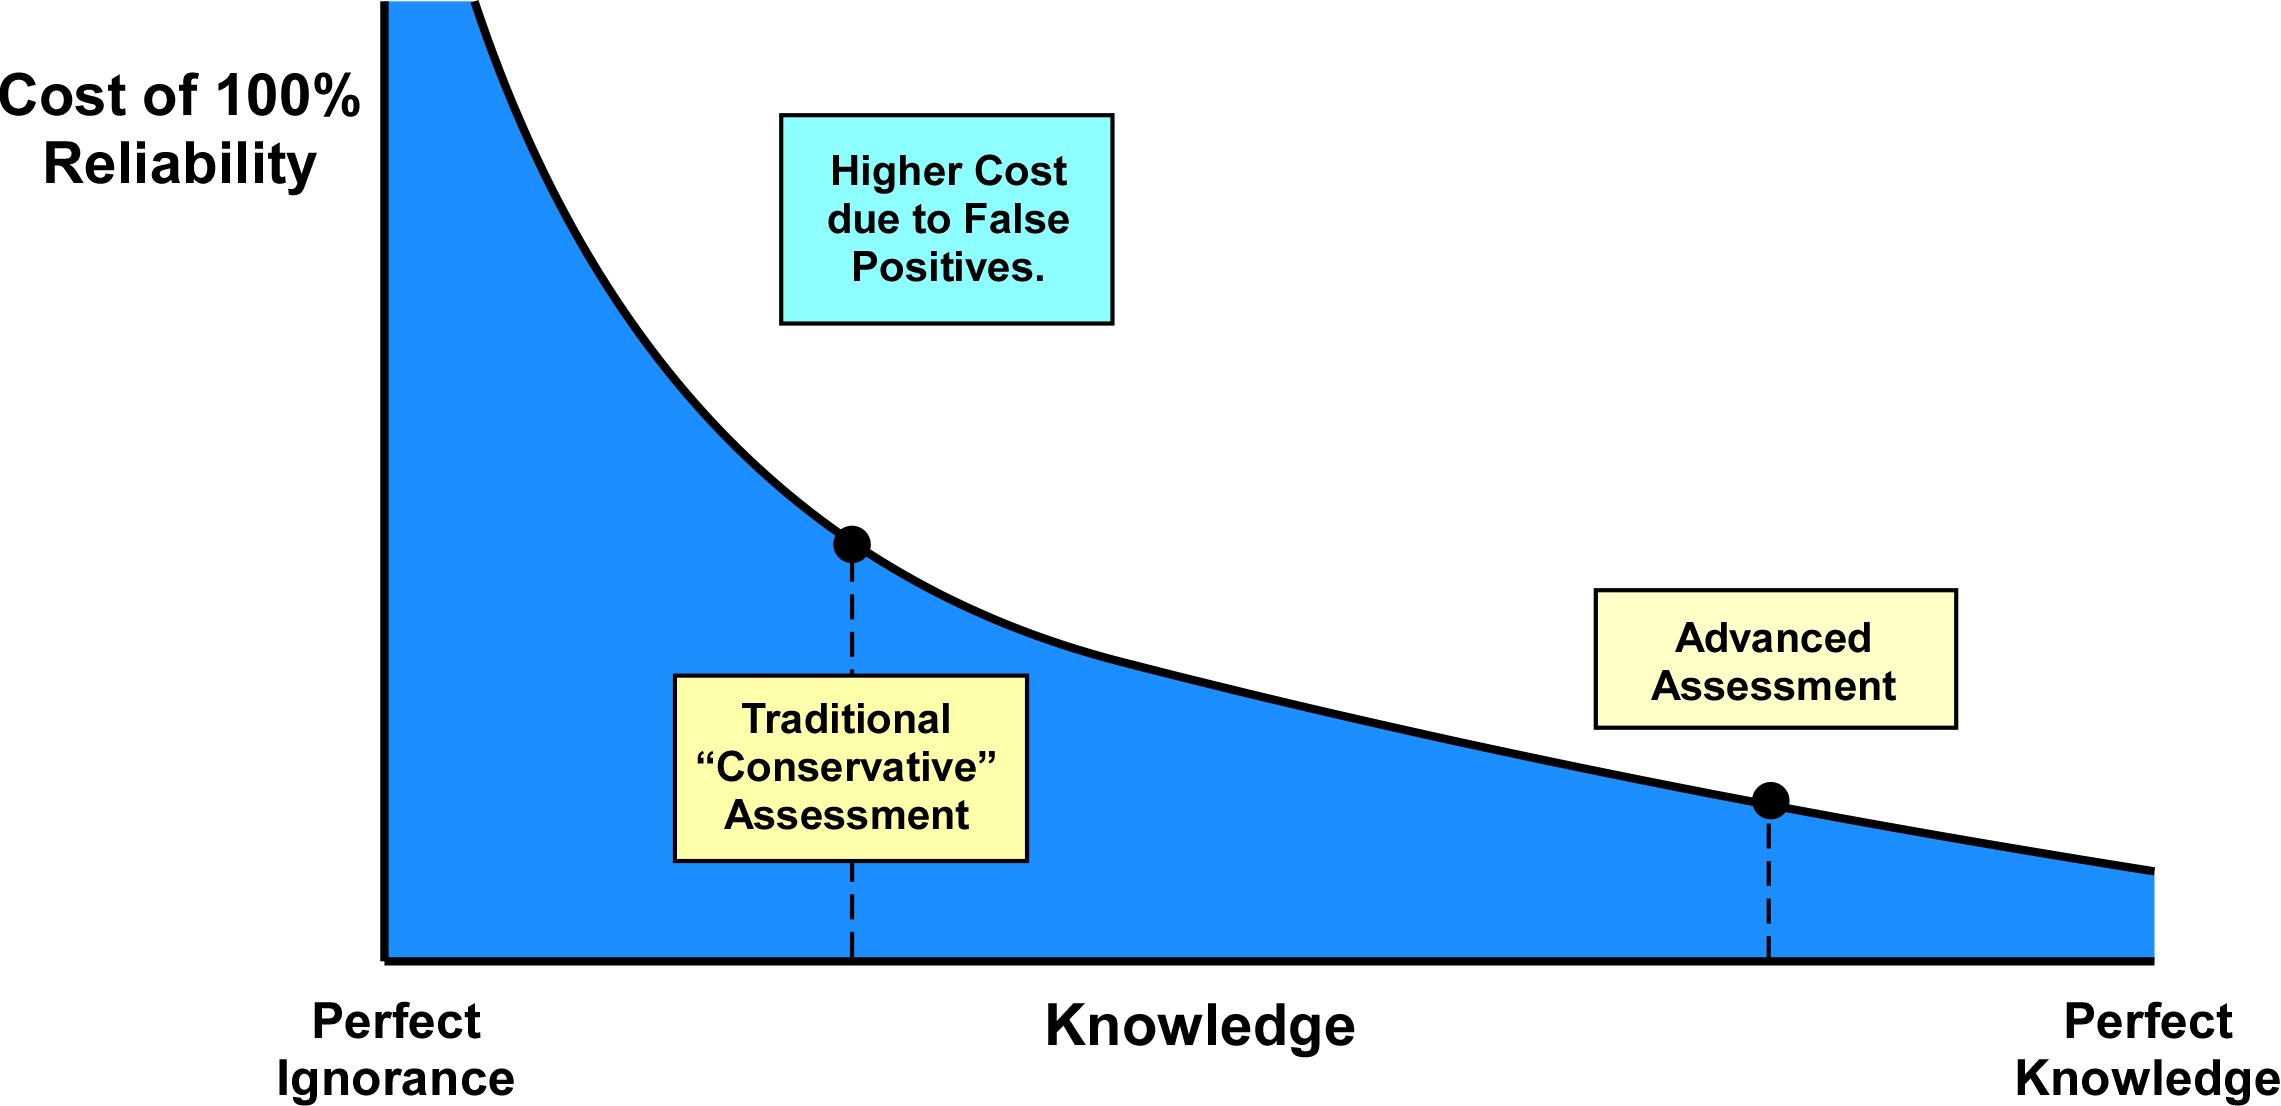
In an ideal world, only true positives and true negatives occur. False positives result in unnecessary expenditures and false negatives result in higher risk. Figure 1 illustrates the effect of knowledge of the pipeline condition on the cost of integrity. Consider two theoretical extremes: 1.) perfect ignorance and 2.) perfect knowledge. The former corresponds to the situation where nothing is known about the condition of the pipe, and digs and repairs are made randomly.
Perfect knowledge means that the operator has advance knowledge of the exact timing and location of failures, which enables just-in-time action to prevent incidents. Real pipelines, of course, operate between these two extremes, and the cost of 100% integrity decreases with knowledge about the presence of flaws and their associated risk because remediating false positives costs money. Advanced assessment methods improve the state of knowledge about the risk that various flaws pose, which reduces the cost of achieving 100% reliability.
 versus knowledge, given a fixed integrity budget.")
Figure 2 illustrates the case where the integrity budget is fixed. Given a finite budget, a “conservative” assessment can result in less reliability compared to what could be achieved with an advanced assessment. The reason for the diminished reliability is that false positives consume the integrity budget, so fewer resources are available to inspect and assess other areas that may contain dangerous flaws. In other words, false positives can lead to false negatives, as described below.
Consider the hypothetical scenario of an operator who owns six similar pipelines, and has a total integrity budget of $6 million. Assume that the ILI cost is $0.5 million per line. Figure 3 illustrates the case where a “conservative” assessment is applied. A large number of false positives cause unnecessary digs and repairs, which results in the budget being consumed without inspecting Lines 5 and 6. Figure 4 illustrates how advanced assessment can result in an optimum use of the integrity budget. The advanced assessment costs slightly more than the traditional approach, but a significant cost saving results from reducing the number of digs and repairs to each line. Consequently, sufficient budget is available to ensure reliable operation of all 6 lines.

Failure models for cracks. The assessment of cracks and other planar flaws is a perfect illustration of new technology offering a distinct advantage over traditional pipeline-centric models. A comparison of old and new approaches is given nearby.
The pipeline industry has traditionally used the NG-18 equation to estimate burst pressure and critical flaw size. This approach, which is also known as the ln-sec model, was developed in the early 1970s. It is a semi-empirical equation that was calibrated to burst test data. This equation contains a known glitch, in that it is overly conservative for long, shallow flaws. Most of the flaws in the original burst test dataset were less than 6 inches long, but a few burst tests on pipes with longer flaws were outliers in the empirical correlation. The problem with this model can be seen more directly when a plot of burst pressure versus flaw length is generated. If the flaw depth is set to zero, the calculated burst pressure decreases with flaw length, which obviously does not comport with reality.
Recently, Keifner has published a modified version of the ln-sec equation. This modified model does not reflect the significant advances in the field of fracture mechanics that have occurred since the 1970s. Rather it merely incorporates a correction factor that eliminates the non-physical trend for zero-depth flaws. The modified ln-sec model represents an improvement over the original method, but more rigorous and accurate approaches are available.

The API and the ASME have jointly published a standard that covers fitness-for-service assessment of pressure equipment, including pressure vessels, storage tanks, piping, and pipelines. This standard, informally known as API 579, includes assessment procedures for crack-like flaws. A variety of analysis options are available, ranging from simplified methods that can be implemented in a spreadsheet to sophisticated computer simulations. The most accurate predictions of burst pressure and critical crack size are obtained from 3D finite element analysis (FEA). Figure 5 shows a typical FEA model of a crack in a longitudinal seam weld.


Figure 6 compares a critical crack size curve inferred from 3D FEA with curves computed from the original and modified ln-sec equations. Curves of this type are used to infer the maximum flaw sizes that survive a hydrostatic test. Cracks that fall below the critical curve are expected to survive the test, while flaws above the curve are expected to result in a leak or rupture.
The three curves agree reasonably well for cracks less than four inches long in this case, but there is a significant difference for longer flaws. This trend is expected, since the original ln-sec equation was calibrated to burst test data for mostly shorter cracks; the ln-sec method has shortcomings for longer cracks, as previously discussed. Note that the original ln-sec model predicts burst for a 14-inch flaw with zero depth. In other words, a superficial scratch 14 inches long should fail the hydrostatic test, according to the original ln-sec model.
To put this in perspective, a 1,500-psi test pressure in a 16-inch X52 pipe with 0.25-inch wall corresponds to 92% of specified minimum yield strength, so the original ln-sec model is obviously incorrect. The modified ln-sec model gives improved predictions for long flaws, but it still underestimates the critical crack depth for flaws > 4 inches long in this case.
Recently, Pipeline Research Council International completed a research project whose aim was to develop an improved failure model for cracks in longitudinal seam welds. This project consisted of a 3D finite element parametric study, where a range of crack sizes, pipe dimensions, and material properties were analyzed. The FEA results were then fit to a series of equations. Thus the new PRCI crack assessment model should approximately match the FEA-based critical flaw curve in Figure 6.
Quantifying toughness of pipeline steels. Both the original and modified ln-sec equations use Charpy impact energy to characterize the toughness of the pipeline steel. Since this model was first published, more sophisticated material tests based on the principles of fracture mechanics have been developed and standardized. Figure 7 shows photographs of the Charpy V-notch and fracture mechanics specimens. A key difference between the two specimen types is that fracture mechanics specimens contain sharp fatigue cracks. This distinction is particularly important when testing electric resistance weld seams.
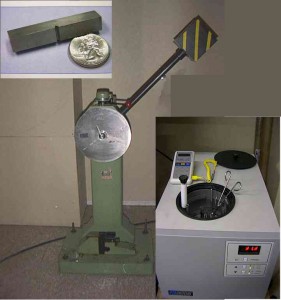
 Charpy V-notch specimen.")
 Fracture mechanics specimen.")
Figure 7: Laboratory specimens (a) and (b) for measuring material toughness.
The photograph in Figure 8 is a close-up of a Charpy notch at an ERW bond line. The notch radius is significantly larger than the width of the bond line. Consequently, the measured toughness reflects an average for the various microstructures in the vicinity of the bond line rather than the material at the bond line. The sharp fatigue crack in the fracture mechanics specimen can be precisely located in the relevant microstructure, thus it is better able to discriminate the variations in material properties from the bond line to the parent metal.

Automated pressure cycle fatigue analysis. Seam welded pipelines that are in cyclic service can experience fatigue failure if not properly managed. Planar flaws that are introduced at manufacture can grow over time due to pressure cycling. Eventually, a growing crack will lead to a leak or rupture if it is not remediated.
Pressure cycle fatigue analysis (PCFA) is a technique that has been used by the pipeline industry to manage the risk associated with seam weld flaws that may grow in service. The PCFA is used to make decisions on the retest interval or re-inspection interval in cases where the integrity management plan calls for hydrostatic testing or ILI, respectively. The PCFA process is fairly time consuming and labor intensive. In a typical case, a pipeline operator sends pressure data to a consultant, who then submits a report to the operator two or three months later. A PCFA is usually performed annually because more frequent intervals are not practical.
Quest Integrity is developing a software system (PACIFICATM) for automatically performing PCFA. Figure 9 illustrates the system’s architecture. At initial setup for a given pipeline, the user enters basic data, such as pumping station locations, pipe dimensions, elevations and material properties. Once the system is online, it periodically imports pressure data from the PI data historian (or similar system), and then processes it through the rain-flow and fracture mechanics algorithms.

Both the pressure data input and the processed output are stored in a database. Reports are generated at regular intervals based on user settings. Because the system is automated, it is possible to obtain virtually real-time updates on pressure cycling. For example, an operator may choose to generate PCFA reports on a weekly or monthly basis. It is also possible to track the growth of thousands of flaws in multiple pipelines.
Some conclusions. 1) Failure models for crack-like flaws that are based on finite element analysis (FEA) are vastly superior to the ln-sec method, which has traditionally been used in the pipeline industry. A new PRCI method based on a curve fit of FEA results provides a simpler alternative to performing custom FEA for each situation that one encounters; 2) Fracture mechanics-based toughness tests are more reliable than Charpy tests, especially for ERW seams; and 3) Pressure cycle fatigue analysis (PCFA) has traditionally been time consuming, so it is typically performed no more than annually, and at a limited number of locations in a pipeline. However, an automated PCFA system that is under development makes real-time monitoring of pressure cycling and crack growth at thousands of locations feasible.
Editor’s note: Literature references are available in the original paper. www.clarion.org, 713-521-5929; Author’s telephone: 303-938-3010.
Acknowledgment
This article is based on a presentation at the February 2012 Pipeline Pigging and Integrity Management Conference organized by Clarion Technical Conferences and Tiratsoo Technical in Houston.

Comments