
July 2012, Vol. 239 No. 7
Features
Cone DP Meter Calibration Issues
The cone meter is a simple and robust generic differential pressure (DP) meter. It has been shown to be remarkably resistant to the effects of both asymmetric and swirling flow. The cone meter is often the meter of choice when there is limited straight pipe length available for a flow meter. Therefore, cone DP meters are becoming increasingly popular gas flow meters.
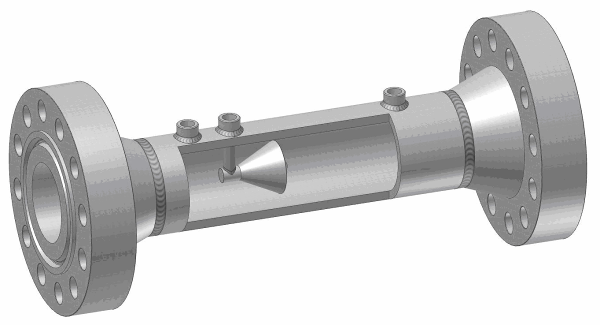
Figure 1 shows a drawing of a cone meter design with a wall cut away to show the cone assembly within the meter body. Flow direction is left to right.
The cone DP meter operates according to the same physical principles as other DP meter types. The differential pressure measured across the cone is proportional to the flow rate. The cone DP meter is a member of the generic differential pressure (DP) meter family and uses the generic DP meter flow rate equation. For a given cone meter geometry this equation uses the discharge coefficient to link known fluid properties and the read DP to the flow rate.
The discharge coefficient of a DP meter is at the center of the discussion of the meter’s accuracy. Just how a DP meter’s discharge coefficient is found and how accurate it is are very important issues when it comes to choosing and using a DP meter.
Like most DP meter types a cone meter must have its discharge coefficient found by calibration. This means testing the cone meter’s performance over the application’s full Reynolds number range. For a given pipe size and fluid properties the Reynolds number is a non-dimensional expression of the flow rate.
Like all DP meter designs, the cone meter can have its discharge coefficient expressed as a constant value. For potentially more precise flow rate predictions the discharge coefficient value can be linked to the Reynolds number. If the discharge coefficient is expressed as a constant value then the cone meter’s flow rate prediction is found directly from the generic DP meter flow rate equation. If the discharge coefficient is expressed as a function of the Reynolds number then the cone meter’s flow rate prediction must involve an iteration of the generic DP meter flow rate equation. With modern flow computers this is a very simple, almost instantaneous and trivial increase in calculation complexity.
A cone DP meter calibrated across the full Reynolds number range of the meter’s application can have the discharge coefficient found to a low uncertainty. From experience it is known that a cone meter’s discharge coefficient is approximately 0.8. However, for any given cone meter its actual discharge coefficient can be found to be somewhere between 0.74 and 0.86, i.e. 0.8 ±8%. That is not to say an individual cone meter’s discharge coefficient varies by 8% – it does not. Any given cone meter will have a discharge coefficient that lies within that range and can be set as a constant value or fitted to the Reynolds number to typically ±0.5 %.

Figure 2: 4-inch, 0.45 beta ratio cone meter being calibrated at CEESI.
Figure 2 shows a 4-inch, 0.45 beta ratio cone meter being calibrated with natural gas flow at CEESI. This meter was previously calibrated with water at lower Reynolds numbers at the manufacturer’s facility. Figure 3 shows the results. A data fit has been found to represent the actual discharge coefficients across this range to within ±0.5 % at 95% confidence. Note that the type of data fit is not important as long as the flow computer can process the chosen equation form and operators do not plan to use the meter outside the range of the calibration.
Important points regarding cone meter calibrations are indicated in Figure 3. Note that the natural gas flow tests were conducted at two pressures, 13.7 & 56.1 Bar. The pressure does not affect the discharge coefficient. That is, it is not necessary for cone meters to be calibrated at the pressure they are to be used. All that is necessary is that the cone meter is calibrated across the Reynolds number range for which it is to be used. This independence to pressure is a specific example of this rather surprising general fact regarding DP meter calibrations.

Figure 3: Results of a 4-inch, 0.45 beta ratio cone meter calibrated with water and then gas.
Often operators insist on the calibration fluid and pressure being the same as the applications. However, this is unnecessary. A counter-intuitive feature of the cone meter (and all DP meters) is that you can calibrate the meter with any single phase fluid and any pressure, as long as you calibrate across the applications Reynolds number range. For example, this means that a DP meter destined for natural gas service at high pressure can be legitimately calibrated with air at a different pressure, as long as the calibration matches the applications Reynolds number range.
This phenomenon even allows gas flow DP meters to be calibrated with liquid flows as long as the applications Reynolds number range can be covered by the liquid flow facility. Figures 3 (& 4) indicate that the liquid (i.e. water) and gas (i.e. natural gas) calibrations agree for a given Reynolds number. The simple equation fitted to the discharge coefficient fits all the data, that is, the water and different pressure gas flow tests.
It is common for cone (and generic DP) meter operators to talk as if cone meters for gas applications must be calibrated with gas flow and cone meters for liquid applications must be calibrated with liquid flow. However, this is not technically correct. The confusion comes from the fact that “gas” and “liquid” calibrations are colloquial terms for “high” and “low” Reynolds number calibrations.
Liquids have a viscosity an order of magnitude larger than gases. This means that for any given mass flow rate in any given pipe size liquid flow has a much smaller Reynolds number than if the flow was of gas. It is often impractical to attempt to calibrate a gas flow cone meter using a liquid flow calibration facility. The liquid mass flow rates required to reach the higher gas flow Reynolds numbers are impractical.
Therefore, liquid and gas calibrations are synonymous with low and high Reynolds number calibrations, respectively. Nevertheless, it should still be remembered that if a liquid flow calibration does cover the Reynolds number range of a gas flow application, then the calibration is valid for that gas flow application.
In order to properly calibrate a cone meter the test facility must test the meter across the appropriate Reynolds number range. But there are several pitfalls regarding cone meter calibration and prediction of the discharge coefficient that can lead to inappropriate discharge coefficient values being assigned to a cone meter. These pitfalls can lead to biases being introduced to the cone meter’s flow rate prediction. These pitfalls are now discussed. Once these issues are known they are easily avoided and the cone meter can have a correct discharge coefficient assigned to it.
Cone Meter Calibration Issues
Calibration Issue 1: Calibrating a cone meter with water flow at low Reynolds numbers and extrapolating the result to higher Reynolds numbers.
If a cone meter is calibrated across a relatively low Reynolds number range (e.g. with water flow calibration facility) it is often not possible to see any discharge coefficient relationship with the Reynolds number over a larger flow range. As a result a low Reynolds number range/water calibration can give the illusion that the meter’s discharge coefficient is constant, and/or can suggest the performance at higher Reynolds numbers is different to what it actually is.
Often, calibration across a larger flow range (usually by means of gas flow tests) shows extrapolation of lower Reynolds number data to be incorrect. Hence, a cone DP meter’s uncertainty rating is only applicable within the Reynolds number range of its calibration. Extrapolating a low Reynolds number calibration for use with high Reynolds number flows invalidates the uncertainty rating and may lead to a significant bias in the flow measurement.

Fig 4: 2-inch, 0.75 beta ratio cone meter water and CEESI gas calibration results.
Figure 4 shows an example. A 2-inch, 0.75 beta ratio cone DP meter was supplied to a gas flow application with a water calibration. The discharge coefficient was stated to be a constant 0.7754 based on a water flow calibration which had a maximum Reynolds number of 114,000. During use at considerably higher Reynolds numbers a potential performance problem was noted. By plotting subsequent gas flow calibration data at Reynolds numbers up to 4e6 it was found that extrapolation of the water calibration data was causing up to a 4.5% under-reading of the gas flow rate. Data fitting all the data across the full Reynolds number range gave a meter uncertainty of ±0.5% as required. Note that the gas flow calibration data merges with the water flow calibration data at the same Reynolds number as required.
Calibration Issue 2: Calibrating one of several nominally identical cone meters and applying that calibration to all the meters.
Many flow meter applications are in systems where multiple identical meters are required. If multiple meters are ordered which are on paper said to be identical, there is a temptation to calibrate one meter only and apply that calibration to all meters of that specification. The rationale of this proposed approach is based on the assumption that because the meters are said to be identical, their performance under the same flow conditions should also be identical. In reality, there are manufacturing tolerances and meters identical on paper can be subtly different in practice. Hence, it is not good practice to calibrate a cone meter and apply its calibration data to other similar meters. Such practice can and does lead to significant flow rate prediction biases.

Fig 5: Comparison of two nominally identical cone DP meter calibrations.
Figure 5 shows data from two 4-inch, 0.45 beta ratio cone meters tested at CEESI. The meters were built by the same manufacturer, from the same drawing, of the same material, at the same fabrication shop by the same personnel using the same equipment. On comparing the two meter calibrations it was found that there was approximately 4% difference between the meter’s discharge coefficients.
There are many such examples available in industry. Note that each cone meter has been calibrated individually to have a 0.5 % discharge coefficient uncertainty but it is not good practice to calibrate one cone meter and apply the results to other similar meters. That is, it is good practice to individually calibrate cone meters. This good practice is equally applicable to other meters, such as Venturi, turbine, vortex meters etc..
Calibration Issue 3: Re-Calibrating a cone meter over a period of time.
A periodic re-calibration of any cone meter is only necessary if confirmation is required that the geometry has not changed due to conditions such as contamination, erosion, corrosion or plastic deformation of the cone. (However, note that all instrumentation must be regularly recalibrated.)
Figure 6 shows a recalibration data set at CEESI. The cone meter had been calibrated in a previous year and the set calibration equation is superimposed on the plot. The cone meter was first tested as it was delivered to CEESI, i.e. as it had left service/before cleaning. It can be seen that the discharge coefficient was found to be slightly lower than the set calibration equation. The meter was then cleaned and recalibrated. It can be seen with the contamination removed the meter’s performance returned to the previous calibrations’ stated performance.

Fig 6: An example of repeat calibrations at CEESI.
If no physical damage or contamination occurs to a cone meter, the meter’s calibration remains valid indefinitely. However, if physical damage or contamination is likely, events in the meter’s application and the meter user requires a low-flow measurement uncertainty, then periodic recalibrations of the meter can give the user assurance. A cone meter diagnostic system is very useful for indicating when a cone meter may require recalibration.
Calibration Issue 4: Estimating a cone meter’s discharge coefficient with no calibration.
A cone meter’s discharge coefficient is somewhere inside the bracket of 0.8 ±8%. The precise value within this bracket can be found by calibration. It would be beneficial to industry if a cone meter’s discharge coefficient could be accurately estimated without the requirement of a calibration. At present, no independent research has shown this to be possible. Cone meter designs can vary between manufacturers and sizes. No massed data set is publicly available to show repeatability of cone meters. Some manufacturers intentionally use loose tolerances on the cone and meter body alignment to aid manufacturing speed and economy of manufacture. However, this is known to have a significant random effect on the discharge coefficient from meter to meter. (The difference in the nominally identical cone meter performances shown in Figure 5 is suspected to be mainly due to this issue.)
Hence, although cone meter manufacturers may claim they can approximate the discharge coefficient (and even extrapolate a water flow calibration to high Reynolds number) without calibration data there is no independent scientific proof to verify these vendor claims. To get an accurate cone DP meter it has to be calibrated across the full Reynolds number range of its application. Once properly calibrated, a cone meter is a very trustworthy reliable flow meter.
Conclusions
Cone meters are generic DP meters and must be calibrated across an application’s full Reynolds number range for the calibration to be valid for that application. This requirement means it is often inappropriate to calibrate a cone meter in a water flow facility if the application has high Reynolds numbers. Extrapolation of cone meter calibration data is not advisable. Each individual cone meter has a unique performance and must be individually calibrated.
Once calibrated, the cone meter’s performance will stay constant until the meter’s geometry is altered by adverse flow conditions. Periodic recalibration is only required if the operator suspects contamination or damage. It is not yet possible for industry to accurately know a cone meter’s performance without calibrating the meter. However, a properly calibrated cone meter can have a flow rate uncertainty of 0.5%.
Authors: Casey Hodges and William Johansen are with CEESI, 54043 Weld County Road 37, Nunn, CO 80648, chodges @ceesi .com, Ph: 970-897-2711.

Comments