
June 2012 Vol. 239 No. 6
Features
Assessing The Effectiveness Of Pipeline Cleaning Programs
There are over 2 million km of oil and gas production pipelines worldwide and ensuring the effective and efficient flow of products through these pipelines makes a huge difference in revenues generated.
The UK Continental Shelf (UKCS) network alone comprises some 14,000 km and the average age of the main export pipelines, representing 63% of the entire network, has already reached a substantial fraction of the typical 25-year design lifetimes. As a result of this, significant effort is now being made by operators looking to extend pipeline network lifetimes. To allow aging networks to stay in service, the integrity of the pipelines needs to be proved and then regular monitoring maintained to ensure the integrity of the pipelines is not compromised. To do this, pipeline operators primarily use inspection tools (Intelligent Pigs) to provide data on the condition of the pipe material. However, for these tools to work effectively, they require the lines to be clean enough to ensure good sensor contact with the metal surface. With typical survey costs in the hundreds of thousands of dollars, the ability to guarantee usable results is of major importance. However, all too often, these surveys are severely compromised because of the poor quality data that is captured because the pipeline is not sufficiently clean.
Pipeline operators generally contract specialist pipeline cleaning companies to prepare and clean their lines prior to inspection tools being run. This typically involves the selection and use of suitable cleaning pigs to remove any debris that may be present in the line, such as waxes and sands. Until recently there have been no measurement tools available to pipeline cleaning companies to enable them to directly assess how effective they have been and whether they have conditioned the line to the standard required. Those tools that did exist such as loggers and calipers tended to give only qualitative verdicts on the internal state of cleanliness of the pipeline. As such a judgment had to be made regarding when a pipeline could be deemed clean enough to inspect, this was very often based on the amount of debris being removed during progressive cleaning of the pipeline. Typically the amount of debris being removed would decline as additional cleaning runs were carried out. An incorrect judgment decision on the cleanliness of a pipeline could result in very expensive failed inspection runs; inaccurate data which may result in potentially unsafe lines either being allowed to continue to operate; or having to be down-rated when this should not actually have been necessary.
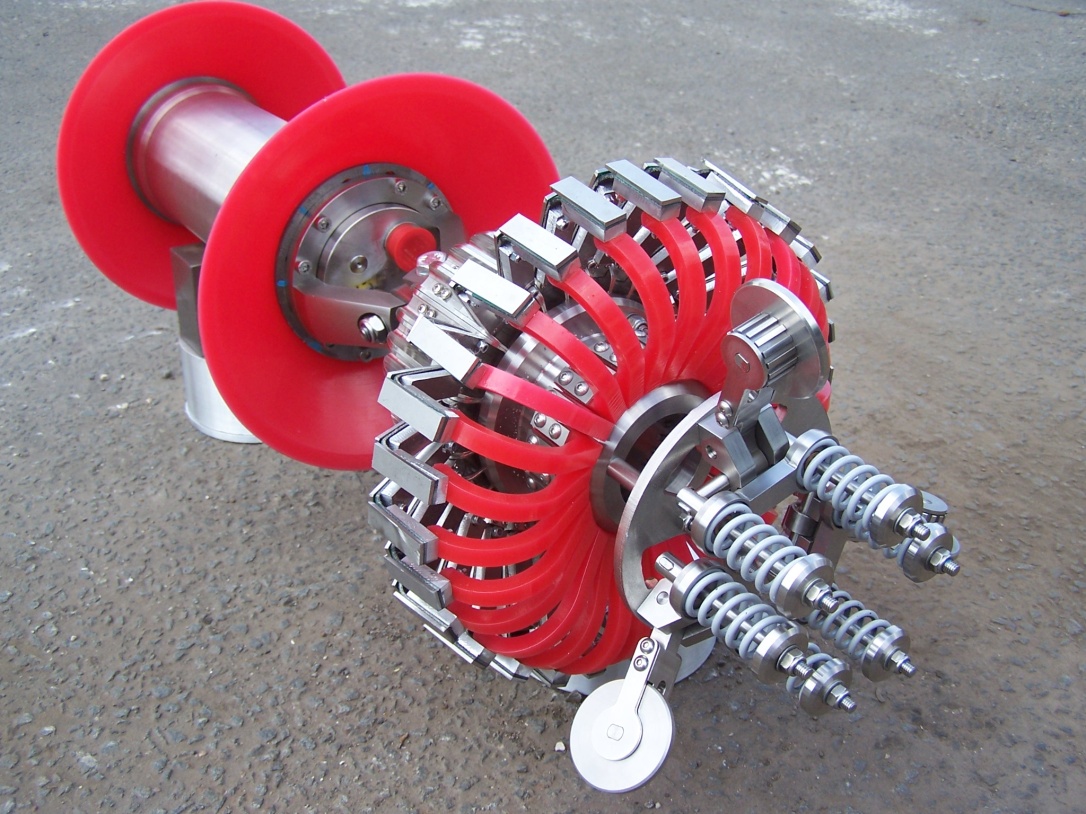
Pipeline Engineering & Supply Co. Ltd. (PE) recognized that there was a need for a specialist inspection tool capable of measuring residual debris deposits. Indeed PE was actively encouraged by some of the world’s leading oil and gas operators to develop such a tool. If this could be incorporated into PE’s existing cleaning service it would be possible to measure the effectiveness of a cleaning job while in progress. To achieve this, PE proposed using Intelligent Calipers as the base technology for the product. These combine proximity sensors to directly measure sensor lift-off with a more traditional multi-channel caliper to measure residual pipe bore. The development and application of the resulting tool is described here.
Background
The first step required in the design of a practical cleanliness measuring pipeline inspection tool is the identification of suitable instrumentation to make the measurement. The outline conceptual design provided parameters that potential solutions would have to satisfy, namely that the pig should have the ability to measure the build up of wax and scale on the inside of the pipeline. The obvious route to achieve this is with something that would have similar dynamics to existing inline inspection detector fingers. It was felt to be neither necessary nor desirable for these to replicate the functionality of such mechanisms, as in order to keep the build cost of the system within targets, individual arms need to be relatively inexpensive. Possible solutions at this stage included: 1) some type of non-contacting measurement, possibly ultrasonic in nature; 2) magnetic proximity sensors (with various technologies possible here); and 3) high-resolution calipering.
The choice between these represents a choice between two competing philosophies on making the measurement. Firstly, using a proximity measurement (i.e. measuring the sensor lift-off from the metal of the pipewall) is a local measurement, which should be relatively accurate. The drawback is that no information is then provided about dents and other out-of-roundness features. On the other hand, an adaptation of a calipering type solution would measure only the internal diameter. Accuracy in this type of system is likely to be limited by the relatively loose tolerances on the internal diameter of API specified line-pipe.
As far as magnetic sensors are concerned, this technology has formed the basis of MFL tools for many years, and its operation in pipelines is well understood. Ironically, the fact that MFL survey results are compromised by the presence of wax and other debris in the pipeline, was a good indication that the instrumentation is sensitive to the debris. The challenge was to find a configuration that would allow the amount to be accurately quantified. MFL systems generally use measurements of axial flux to detect defects; however, the radial flux can be shown to be strongly dependent on the distance to magnetic pipe material.
Recent advances in intelligent calipering technology have resulted in improvements in the tools used to carry out these assessments, allowing for far greater accuracy when measuring the depth of debris present on the pipewall. PE performed a study on techniques currently adopted for assessing the cleanliness of pipelines and in particular the use of Hall Effect based sensor technology, configured to detect proximity to the pipewall. With the Hall element mounted on a dummy sensor sledge and a suitable magnet separation, clear sub-millimetre resolution over the first 20 mm of lift-off was readily obtained. Based on this, a tool with a suitable arrangement of pig mounted sensors which has the capability to measure the circumferential profile of debris to an accuracy of ±0.5 mm has been developed.
The debris measurement system was specified to have a maximum angular separation around the circumference of the pipe between sensor arms of 15° (a linear spacing of approximately 33 mm for a 10 inch tool), with an accuracy of measurement of ±0.5 mm over a range of 0 – 20 mm. Measurement resolution was specified to be 0.1 mm. Separation values were based on an understanding of the number of arms required to give a good picture of the circumferential profile of any debris in the pipeline, tempered against the practicalities of how many arms could physically fit around the circumference of the tool. The accuracy of measurement is a compromise between the desire to provide as accurate a measurement as possible, and the realistic expectations raised by a preliminary study.
Readings are taken every 5 mm along the axis of the pipeline, which is in line with high specification caliper pigs and other intelligent inspection systems. A fall-back time-based data acquisition system forms part of the specification in order to ensure that data was captured even if the odometer system suffered complete failure.
After preliminary consideration of the likely nature of the mechanical design, the decision was taken to include caliper measurements in the system specification – given that the tool was going to include wall-contacting arms, the extra engineering to include a measurement of the angle between the pig body and the arms was thought to be worthwhile. The specification of measurement for the caliper system was prepared so as to be consistent with the debris measurement system. The range of arm movement to be measured was specified as 75 – 137 mm for the 10-inch prototype, with other values identical to the offset sensors. This gives a maximum ID for measurement of 274 mm (vs. 254 mm nominal), while allowing an internal dent of 20% of ID to be measured on a single arm.
It has to be accepted that a practical system cannot currently be engineered that is capable of making an accurate measurement of the total volume of debris in a pipeline, particularly for low quantities of debris. For example, a 10 km long 10 inch pipeline with a uniform coating of 1 mm of debris would contain approximately 8 m³ of debris. Taking into consideration the above specification, a system might report this as anywhere between 4 – 12 m³, while still meeting performance expectations. This is a consequence of the integration of small thicknesses of debris along lengthy pipelines.
Prototype Testing
Two test spools were prepared for use in pull-through testing on PE’s UK site. The first of these consisted of two short, flanged 10 inch pipe sections, each only 500 mm in length. These had moulded polyurethane inserts the thickness of which varied from 5 mm to 20 mm in steps of 5 mm (Figure 1). This section was intended to provide a test of the ability of the tool to accurately measure arm lift-off from the pipe-wall.

Figure 1 – Offset Test Section
The second test section consisted of a 4m long 10 inch pipe spool with five simulated dents, ranging in size from approximately 2% of ID up to 25%. These were created by heating the pipe before deforming it. This spool was intended to test the caliper functionality of the tool, and give information on its ability to discriminate between dents and offsets due to the build-up of non-ferrous material on the pipe interior.
The PECAT™ tool was built up and pulled through the test section using a winch. Speeds in the range 0.5 – 1.0 m/s were achieved. The 10 inch spider was observed to give acceptable centering of the tool as it travelled through the pipe. The test was repeated a number of times in order to provide baseline data on repeatability of measurement.
Figure 2 to Figure 5 show results from the pull-through tests. Outcomes are seen to be in line with expectations.

Figure 2 – Test Section 1, Pull-Through

Figure 3 – 25% Dent, Pull-Through Test.
Test.

Figure 4 – 3% Dent, Pull-through Test.

Figure 5 – 2% Dent, Pull-through Test.
Video monitoring of the pig motion showed that the arm springs were sufficient to centre the sensor spider in the pipeline. As it passed through the test section, the largest (25%) dent was seen to push the spider over to one side, as expected. This is in line with the expected design behaviour to permit the tool to pass large obstructions by dividing the required displacement between opposite arms.
A further set of pigging tests were performed at Petrofac’s Montrose, UK, facility. Figure 6 shows the test loop, and Table 1 gives more detailed information about the facility.

Figure 6 – Montrose, UK, Test Facility.
Table 1 – Montrose, UK, Pipe Test Loop Details.

The same test spools as were used with the facility as had been used during PE’s pull-through tests. The spools were orientated with the coated section first, with the thinnest coating at the upstream end. Pigging speeds from 0.25m/s up to 1.2m/s were tested. The overall aim of testing was to firstly to demonstrate the pigability of the tool, and secondly to generate data sets with the tool for performance analysis.
Figure 7 to Figure 10 show sample results from the loop trials. These were generally in line with the expected performance of the tool; however a number of issues were identified which required further engineering.

Figure 7 – Pig Trials, Test Section 1.

Figure 8 – Pig Trials, 25% Dent.

Figure 9 – Pig Trials, 3% Dent.

Figure 10 – Pig Trials, 2% Dent.
In order to verify performance under field conditions, and provide initial track record to potential commercial users, a field trial was sought. Criteria were ease of access (i.e. preferred location in the North Sea), a supportive pipeline operator, a suitable line size and run time, and the known presence of material in the line to be measured. A line meeting these criteria was identified and a field trial secured. A further field ready-prototype tool was constructed, incorporating knowledge gained from the earlier test work, and this trial was run in Spring 2010.
The PECAT™ tool was successful in logging data from all instruments during the initial trial run (28 debris detecting sensors, 28 caliper arms plus auxiliary data sensors). Data logging was, however, terminated due to full memory condition being encountered after approximately 80 hours run time. The data retrieved was of high quality.
Offset arm measurements were generally in line with prior knowledge of the likely state of the pipeline. Overall indications were that the line was generally clean, with short wax coatings, of moderate thickness, (~2 mm) detected near cooling zones as expected. Figure 11 shows the offset measurement for the only significant short-range feature found in the line. This is an approximately square feature 250 mmx250 mm and 4 mm deep. Apart from being non-ferrous, the nature of this obstruction was not clear. The caliper measurement also detected this intrusion into the line, perhaps suggesting a foreign object.

Figure 11 – Lift-off Anomaly.
The PECAT™ caliper arms also functioned throughout the survey. Although at this stage they were intended only to allow discrimination in the offset sensor signals between dents and similar features, one outcome of the survey appeared to be that the previously reported ID of one of the line sections was incorrect by approximately 7 mm.
Operationally as described above, one of the main uses of this type of tool is in the assessment of the effectiveness of pre-inspection cleaning programs. As an example of this, PE used the PECAT™ as part of a pre-inspection cleaning program of an oil export pipeline in the North Sea. Two surveys were performed, the first early in the cleaning program, the second after the program was considered to be complete.
The pipeline was known to be susceptible to wax fall out during normal production flow and as such significant quantities of wax deposition can be assumed to have been deposited on the internal pipewall. The previous last cleaning and inspection program had been carried out some years previously, and at that time difficulties had been experienced in obtaining a complete set of line data. Routine cleaning pig runs had continued to be carried out using disc/brush cleaning pigs although the regularity of these runs had not been consistent and the results from the runs were considered to be inconclusive.
To meet operator requirements, PE supplied up-front engineering studies and documentation, cleaning pigs, field personnel and equipment offshore for the duration of the cleaning program and management of the Inspection Contractor.
PE carried out an initial debris assessment of the pipeline using an ATEX rated PECAT™ tool to provide a baseline condition for the cleaning program. The cleaning program was then managed to remove the debris in a progressive manner, using a number of cleaning tools of varying aggressions. This philosophy was adopted to avoid any cleaning tools becoming stuck in the pipeline. After the returned debris volumes were reduced consistently to an acceptable level, a gauge pig was run prior to the second PECAT™ survey. The second PECAT™ survey was run and the data interrogated to verify the debris volumes removed by the cleaning program and to indicate the volume of remaining debris. The data was reviewed by the Inspection Contractor to confirm the viability to run the MFL inspection tool. The dummy tool was then successfully run prior to the MFL inspection tool run.

Figure 12 – Typical Arm Data – Run 1.

Figure 13 – Typical Arm Data – Run 2.
The initial survey showed significant quantities of debris present, particularly in the first few kilometres of the pipeline, at thicknesses up to 2 mm. There was also evidence of some intermittent very large deposits of material. Estimation of total volumes of debris present from this type of tool is subject to uncertainties, but it was clear that a significant amount of wax was present, of the order of 10 cu. m. Following a six week cleaning program PECAT™ was run a second time. Significantly smaller quantities of wax were detected on this second run, amounting to no more than a quarter of that previously detected.
Figure 12 and Figure 13 show some typical arm data for the two surveys, with the second survey indicating only residual quantities of wax present in the line.
Acknowledgment
This article is derived from a paper presented in Feb. 2012 at the Pipeline Pigging and Integrity Management Conference in Houston.
Authors: David Russell has been engaged in the pipeline pigging business for 20 years. He was educated as a physicist at Edinburgh’s Heriot-Watt University. Since 2008 he has been performing a product development role for PE with particular responsibility for the development of the PECA™T debris detection tool. Contact care/of: Andrew Cargill, andrew.cargill@pipelineengineering.com, www.pipelineengineering.com.
Neil Errington is Pipeline Engineering’s Global Technical Advisor. His career commenced in 1974 in the old UK Northern Gas region. He started with PE in 2008 and has held account management and business development roles, particularly related to new technologies.

Comments