
June 2012 Vol. 239 No. 6
Features
Hurricane Season Outlook For 2012
After a look back on another active hurricane season in 2011, we will detail the North Atlantic basin tropical forecast for 2012. The forecast will examine the impact of factors ranging from sea surface temperatures in the Atlantic and Pacific Oceans to winter rainfall over western Africa. All of these factors point to a normal Atlantic hurricane season.
Review of the 2011 Hurricane Season
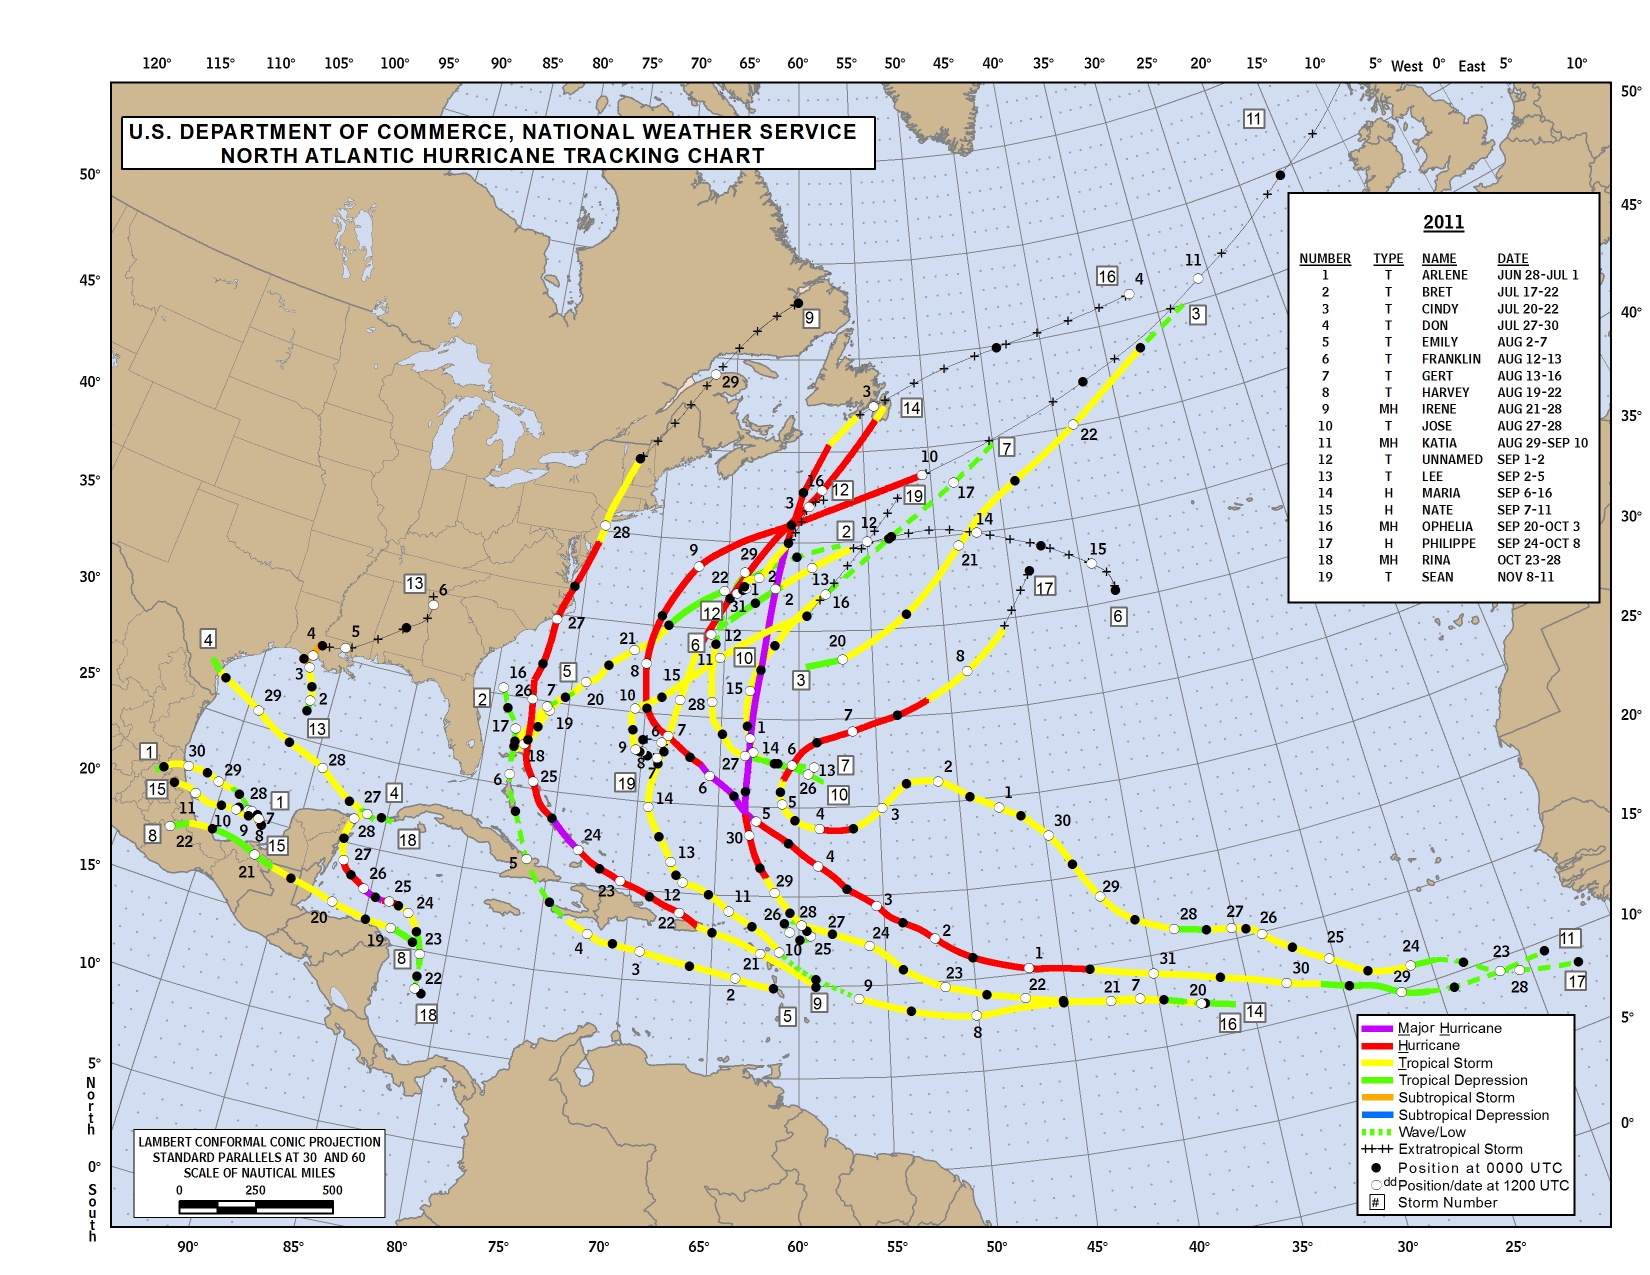
The 2011 North Atlantic hurricane season was more active than the long-term normal with 19 named storms, seven hurricanes and four major hurricanes. (A major hurricane is one that is classified as Category 3 or greater on the Saffir-Simpson scale, i.e., maximum sustained winds are 111 mph or greater.) This season tied with the 1887, 1995 and 2010 seasons as the third-most active season on record.
A few facts about the 2011 hurricane season:
- Approximately $12.2 billion in damages were caused across the United States and the Caribbean. The primary contributors to this were flooding, storm surge and high winds associated with Hurricane Irene and flooding resulting from Tropical Storm Lee.
- Two storms were upgraded after the 2011 hurricane season was over during post-season analysis.
- In Figure 1, the 12th storm listed “Unnamed” was initially identified as 94L on Aug. 31. However, the ensuing development to a tropical depression and then a tropical storm was not recognized by the National Hurricane Center.
- Hurricane Nate was originally thought to be a tropical storm. However, a review of data from a PEMEX rig that was not available showed that Nate reached hurricane strength for 12 hours.
Climatology
Before we begin our forecast for the 2012 North Atlantic tropical season, a look back over the past six decades is in order. Over this time frame, there have been cycles of tropical activity across the North Atlantic basin. As shown in Table 1, the 60-year average is 10.9 named storms, 6.2 hurricanes and 2.6 major hurricanes. This year, we have also introduced the 30-year median to Table 1.
The inclusion of the 30-year median shows a rise in tropical activity across the North Atlantic basin. This can generally be attributed to the warm phase of the Atlantic Multidecadal Oscillation (AMO) that been in place since 1995. Over the past 16 years, the tropical season has been more active with four of the most active seasons (1995, 2005, 2010 and 2011) in the past 60 years occurring in this time frame.

Table 1: North Atlantic Ocean tropical season climatology showing the 60-year mean (1951-2010). 30-year median (1981-2010) and average values during the period in which the Atlantic Multidecadal Oscillation (AMO) has been in its warm phase.
Sea Surface Temperatures
Contributing factors to the annual level of tropical cyclone activity across the North Atlantic basin are the sea surface temperatures (SSTs) of both the Atlantic Ocean and the equatorial Pacific Ocean. For the Atlantic Ocean, cooler SSTs lead to lower evaporation rates, a less active Intertropical Convergence Zone (ITCZ) and the ITCZ remaining closer to the Equator. These factors combine to yield a less active tropical season.
Across the equatorial Pacific Ocean, the variations in SSTs are known as the El Niño-Southern Oscillation (ENSO). There are two phases of ENSO, El Niño (warmer than normal SSTs) and La Niña (cooler than normal SSTs). During an El Niño event, the vertical wind shear (i.e., the difference between the upper-level and lower-level winds) is increased across the North Atlantic basin. The potential for tropical development across the North Atlantic basin is decreased due to this high vertical wind shear.
Figure 2 shows a recent view of the worldwide SST departures from normal. The remnants of a fading La Niña are seen in the blue oval, extending along the Equator between about 130°W and the International Date Line. Warm water is upwelling off the Ecuadoran coast and spreading west along the Equator. Across the tropical extent of the North Atlantic basin (highlighted in red oval), as a whole, temperatures are near normal. Below-normal temperatures off of the west coast of Africa are due to stronger than normal upwelling and there are slightly above-normal temperatures across the central Atlantic.

Figure 2: Worldwide sea surface temperature anomalies (°C) as of April 2, 2012. (Source: NOAA – Earth System Research Laboratory)
The long-range climate models predict that the Pacific Ocean will be returning to an ENSO-neutral state during the spring months and then continue into the summer months. Figure 3 shows the output from 24 forecast models and everyone shows a developing El Niño phase. (The definition used for an ENSO-neutral state is that the Niño 3.4 region is between -0.5°C and 0.5°C. The Niño 3.4 region extends from 120° to 165°W, between 5°N and 5°S.)

Figure 3: Niño 3.4 forecast model outputs from 16 dynamical and 8 statistical models. This information is compiled and published by the International Research Institute for Climate Prediction at Columbia University.
The impact of the normal SST across the equatorial Pacific basin is that the vertical wind shear across the tropical Atlantic will be stronger than it was last year during the La Niña event. The stronger vertical wind shear is a hindrance in the development of tropical systems and will be one of the primary factors in the development of our tropical Atlantic seasonal outlook.
Atlantic Multidecadal Oscillation
Long-term cycles of tropical activity are generally associated with the Atlantic Multidecadal Oscillation (AMO). This is reflected in the data presented in Table 1. The AMO is naturally occurring pattern over the Atlantic basin which is typified by variations in both the sea surface temperature and the sea level pressure fields. As indicated by the phase names, the “warm phase” of the AMO is generally associated with weaker trade winds and warmer sea surface temperatures (SSTs).

Figure 4: Monthly values for the AMO index, 1856 through 2011.
The most recent AMO value of 0.058 (March 2012) is a weak positive value. But in aggregate, the 2011-2012 Northern Hemisphere winter has been normal to slightly below normal. The last sustained cold AMO phase values were in early 2009, which preceded an Atlantic tropical season with nine named storms, three hurricanes and two major hurricanes. While the lifespan of an individual phase is uncertain, a complete cycle is estimated to last roughly 60-70 years. The implication is that more active tropical seasons for the North Atlantic basin may last another 10-20 years. However, as demonstrated with the 2009 Atlantic tropical season of only 10 named storms and three hurricanes, a cooler or normal AMO can impact the Atlantic tropical season.
Sahel Desert Rainfall
The role that the Sahel rainfall plays in the hurricane season forecast is that the dust acts as an inhibitor to potential tropical development. When drier winter and spring seasons are experienced across the Sahel, more dust is lifted into the atmosphere, thereby negatively impacting how active the tropical season would be. Conversely, a wet winter and spring would result in less dust moving across the Atlantic, resulting in less of an effect of the tropical season.
The La Niña phase across the equatorial Pacific typically brings heavy rainfall and flooding to West Africa during the winter months and this has certainly been the case this past winter. As noted above, the heavier rain will result in less dust being transported across the Atlantic and less of an impact of the hurricane season. This is the only item that is considered a positive factor for a more active season for the tropical Atlantic basin.
Coupled Forecast System
The Coupled Forecast System is a fully coupled model and represents the interaction between the earth’s oceans, land and atmosphere. All three runs of the CFS show above normal precipitation along the Gulf Coast. While in varying locations along the coast in the three forecast runs, the forecast trend of a wet September may be associated with the climatological peak in hurricane season. This serves as a reminder that even in normal hurricane seasons, the Gulf Coast remains at risk for a landfalling tropical system.
Conclusion
The Wilkens Weather team has examined all of the factors discussed in this report and our forecast for the 2012 North Atlantic hurricane season is presented in Table 2.
* Major hurricane – A Category 3 or greater hurricane, as measured on the Saffir-Simpson scale. Maximum sustained winds are 111 mph or greater

Table 2: Wilkens Weather’s 2012 North Atlantic basin hurricane season forecast.
Author
Aaron Studwell is a Senior Meteorologist for Wilkens Weather Technologies which provides worldwide site-specific weather forecasts, tropical and severe weather advisories, ocean current & eddy forecasts and climatological studies. His work includes worldwide tropical forecasting, conducting research to improve the accuracy of tropical forecasts, and coordinating business development efforts. He has more than 10 years of experience in energy weather forecasting and natural gas analysis. Studwell was one of the first meteorologists to work in the energy trading sector.
Prior to joining Wilkens Weather, Studwell was the Senior Manager of Research and Development at Weather Insight. He has also worked in senior research and forecasting roles at Reliant Resources, CMS Energy and Avant Capital Management. Studwell graduated from the University of Michigan with a Bachelors of Science in Aerospace Engineering degree and from the Texas A&M University with a Masters of Science in Meteorology.

Comments