
June 2012 Vol. 239 No. 6
Features
Natural Gas Under Siege
The North American natural gas producing industry is “under siege.” The current price is far below the full cycle cost to replace gas that is produced and sold. The details of the predicament are described. With this article, I want to start with some of my solutions first.
Solutions
I envision various solutions to this dilemma, based on my four decades of gas consulting experience.
Unconventional Gas Demand
Unconventional gas demand allows producers to upgrade their gas price to an oil price equivalent:
1. Exporting gas as LNG to Asia can reduce the gas supply overhang, upgrading the overall gas price. Export capacity can be developed at existing LNG import facilities, such as Sabine Pass, Cheniere, and Lake Charles, LA, in the U.S., or at new “greenfield” projects such as the KM LNG project on the west coast of Canada that Apache is championing with top independents Encana and EOG;
2. Additional new announced greenfield LNG exporting projects by worldwide major Shell, with support from leading Asia firms, along with other potential LNG west coast export projects;
3. Leaders such as Talisman, which is joint venturing with Sasol regarding the development of new business strategy of synthetic crude oil to take low-cost natural gas and produce a premium-priced diesel fuel;
4. Implementing gas policies pertaining to gas for vehicles and trucks, especially commercial fleets in urban areas.
Other Demand Solutions
1. Preference for gas use in power generation, in recognition of the much lower level of emissions than coal;
2. Considering expanding the ethanol additive for vehicle fuel (natural gas is a key feedstock for making ethanol).
Potential Supply Solutions
1. Cost discipline by producers, not only to constrain current gas drilling until more of a supply/demand balance is achieved, rather to shut in gas production from gas fields that can be produced later. A minority of producers are doing this, however, to a very modest extent
2. Scheduling annual production maintenance during periods of low gas demand (and price).
Natural Gas Under Siege
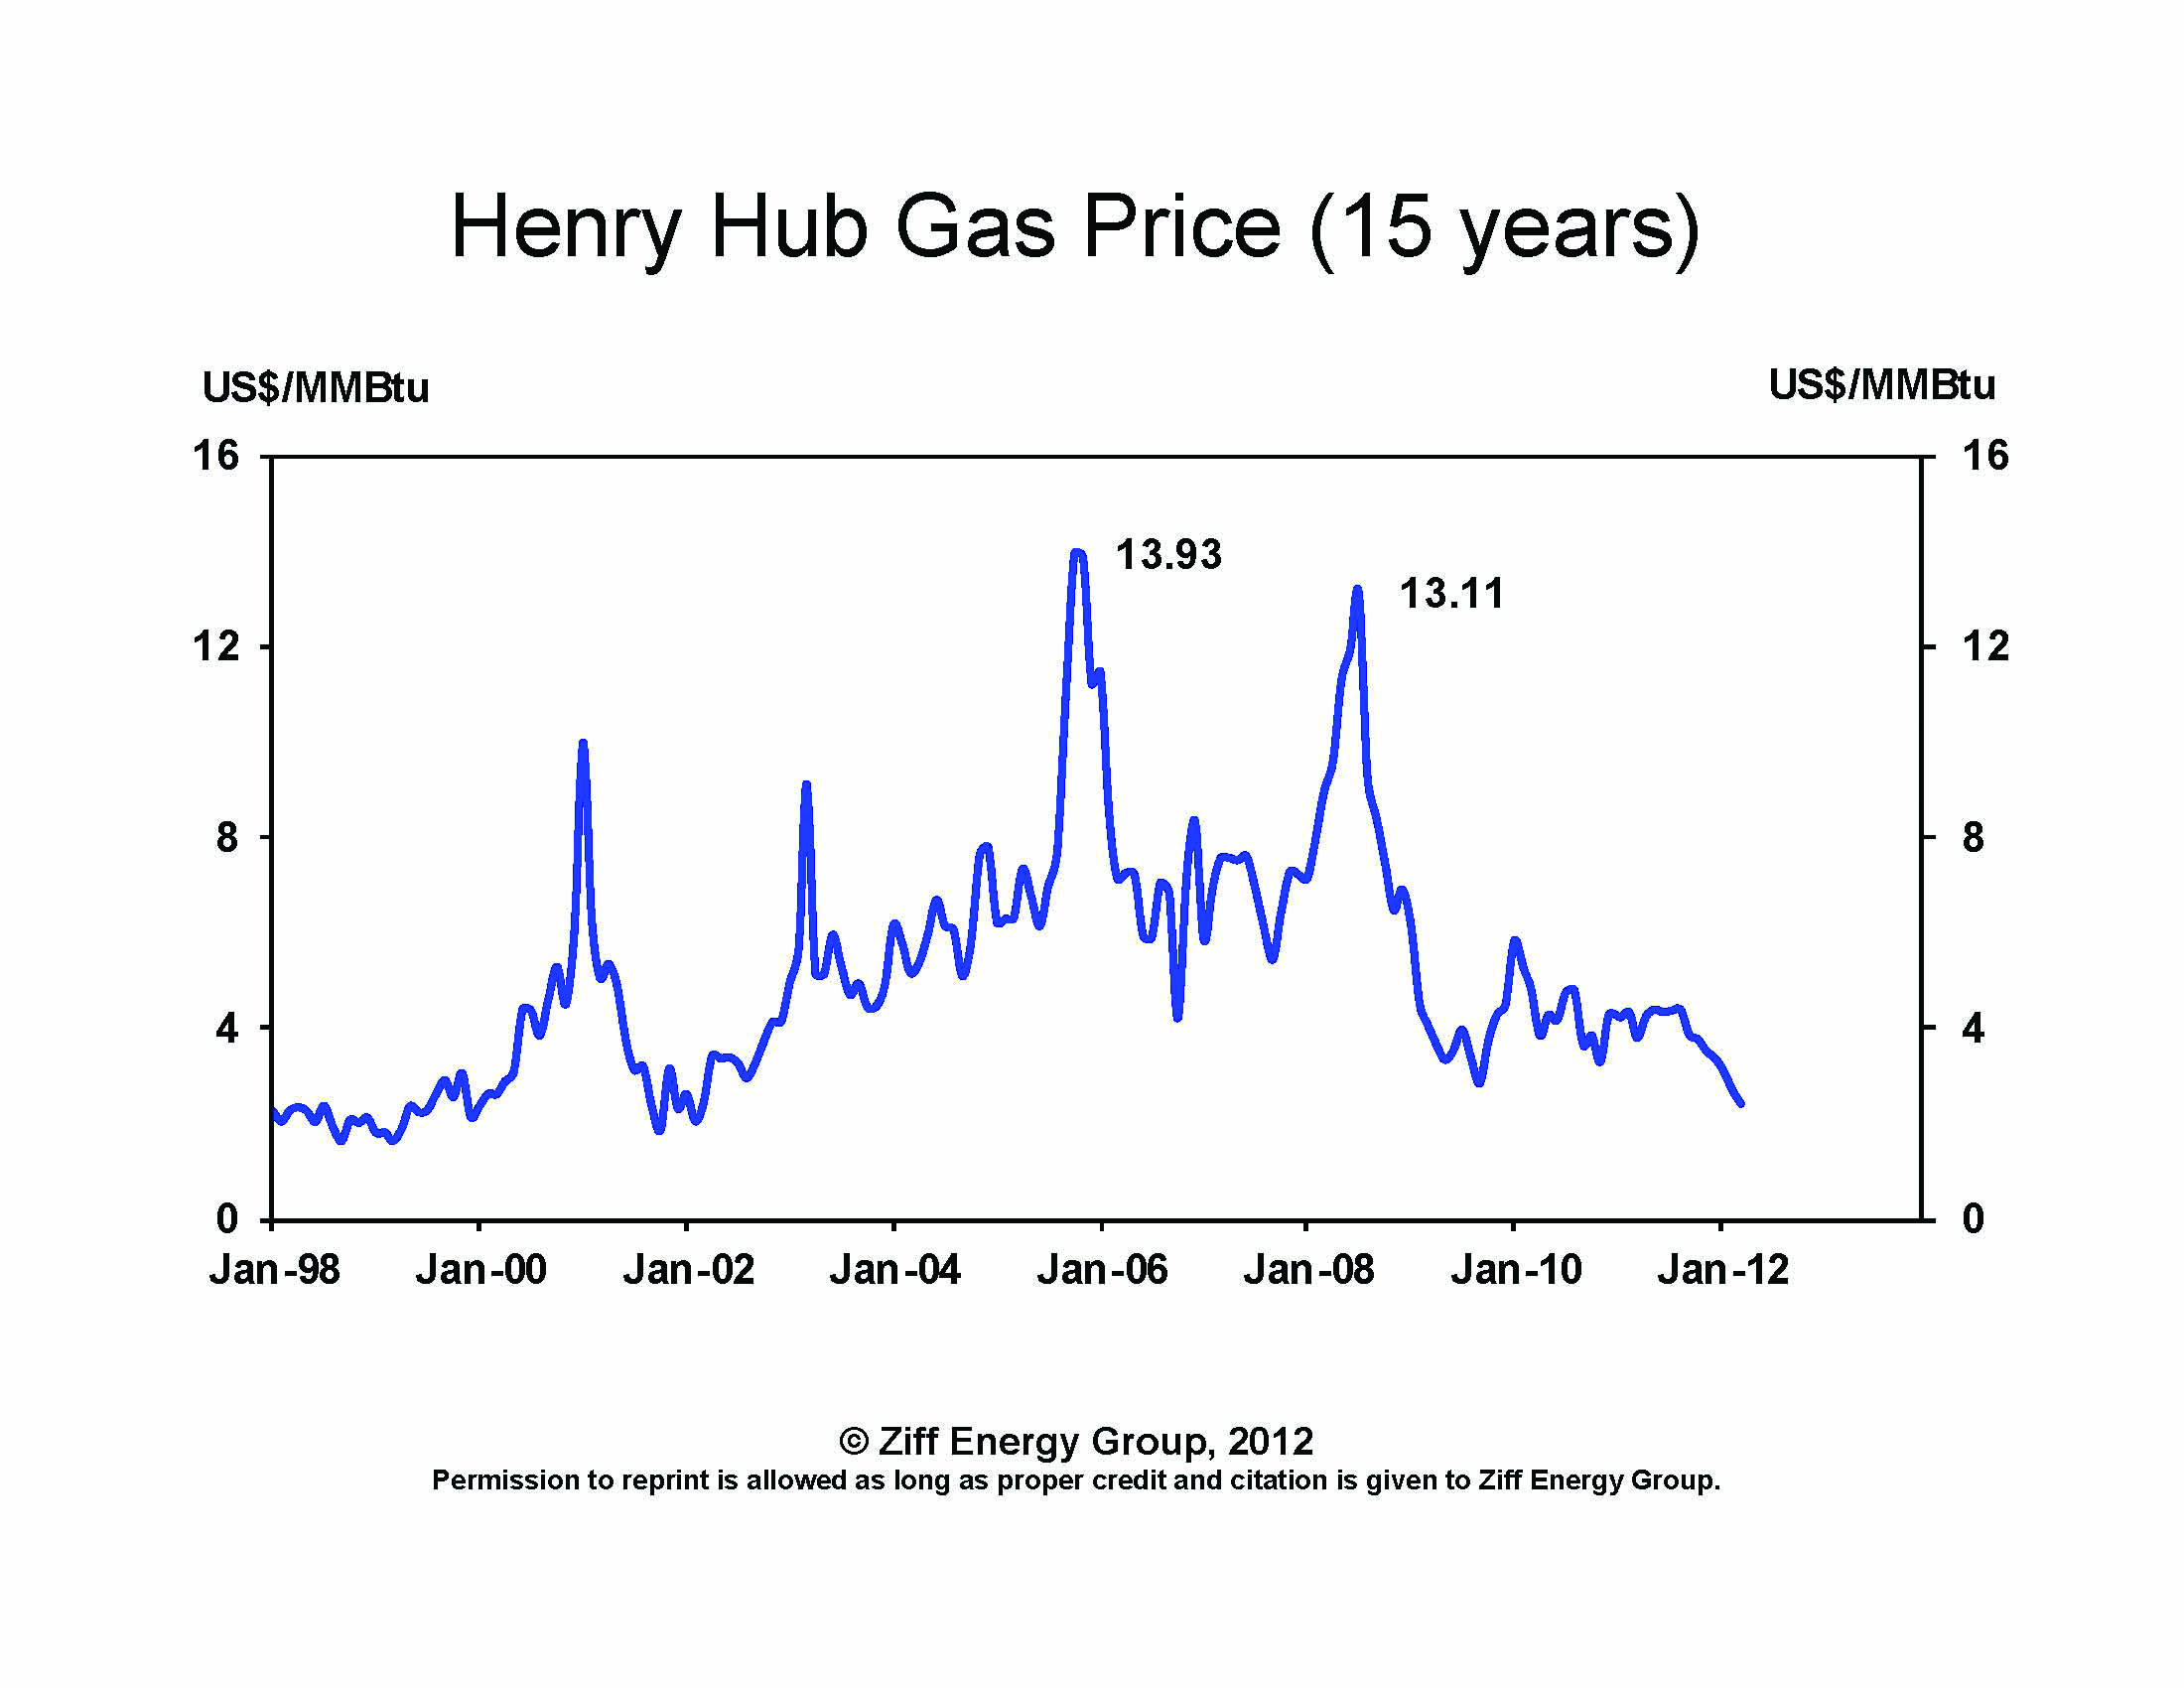
As Figure 1 shows, U.S. natural gas prices at Henry Hub have descended to a low not observed since the 1990s when the industry was awash in natural gas due to the “Gas Bubble.” The picture is the same for Canadian gas prices.

Figure 1: Henry Hub Gas Price (15 years).
Unfortunately, gas prices are so low that the cash costs for many wells (operating costs, royalties) exceed the gas price received, resulting in negative cash flow. On a “full cost” basis, all producers are losing a ton of money. What does full cost mean? Simply put, it is the price required to replace the gas produced. As Figure 2 illustrates, the full cost includes 1) Operating Costs; 2) Royalties payable to the owner; 3) the large capital cost to Find and Develop the reserve; 4) Cost of Capital, which includes interest on corporate debt, and profit on the Investment; 5) Corporate Income Taxes; and 6) Corporate Overhead (staff and offices).

Figure 2: Sinking Gas Fortunes.
For producers selling natural gas at current low levels, each Mcf produced generates a financial loss; it is equivalent to attaching $3 to each Mcf sold, and saying to the consumer “Here’s your special deep discount – please enjoy.” Given that the average proven gas reserve life is under a decade, if these economics continue for one to two more years, there will be a huge gap in the cash flow needed to replace current low-priced production. Raising that revenue for reinvestment by taking on more debt, or issuing equity at depressed stock prices is not very attractive!
Why are prices low? For how long? Gas prices are so low primarily due to the energy industry’s technical ingenuity and creativity of harvesting gas from shale gas (and tight gas) that as little as a half dozen years ago, was thought to be permanently trapped. From only 1-2 Bcf/d early in the last decade from the Barnett Shale near Dallas, TX, North America Shale Gas will account for 35 Bcf/d of production (40%) of total North American supply by 2020 — a truly stunning development.
The full cycle cost of shale gas is often $1-2/Mcf below traditional conventional gas, due to the large resource accessed by each well. Further, there has been a number of large farm-ins or joint ventures by international companies, whereby they pay for a significant portion of future development – thereby encouraging even more drilling than if drilling were driven solely by the operator’s own cash flow. Also, a number of producers in recent years were able to augment their revenue and cash flow through financial hedging (pre-selling gas volumes on the NYMEX futures market at a higher price) – this opportunity has now largely vanished, as the futures prices are much lower and closer to current gas prices than in prior years.
U.S. rigs drilling for gas climbed to a high of 1,500 rigs in 2008 and have since been dropping rapidly. This will result in much less new gas supply coming on-stream in 2012 and 2013.
For Canadian gas, activity peaked at 360 rigs in the 2005-2006 era and has plummeted since to an estimated 60 rigs in 2012. But these figures tend to understate the level of actual effective drilling, as a majority of wells are now drilled horizontally into the shale and tight gas reservoir, and therefore yield more reserves and production than the prior vertical wells. Shale gas has become economic in a hurry due to two technological advances – 1) horizontal drilling and 2) massive hydraulic fracturing (which has become the topic of much public debate). Figure 3 provides the North America rig trend for the past decade, illustrating the rise and the fall parallel to gas prices.

Figure 3: North American Gas Drilling Trend.
Figure 4 shows the widespread shale gas basins across North America. Currently, shale gas supply is coming largely from six U.S. basins: Barnett, Eagle Ford, Fayetteville, Haynesville, Marcellus and Woodford.

Figure 4: Shale Gas Basins Map.
Traditionally the shale rock was a source rock for the gas; however, now it is viewed as a reservoir, adding hundreds of Tcf in reserves. It is a “game changer” for U.S. energy supply (and potentially abroad as well). In Canada, the main shale basin, the Horn River, in northeast British Columbia is rich, yet remote. Its economics will depend on the linking of the gas supply growth with the “oil price equivalent” higher prices from the proposed LNG export projects. Some U.S. shales tend to be located farther to the east and closer to markets than the traditional U.S. gas supply basins; consequently, the new supply is causing major changes in the North American pipeline systems.
The very low current gas prices, and the drop in futures prices for hedging, means that even much shale gas development is not economical today (except for gas in basins that contains natural gas liquids, which sell for a much higher price than the gas itself). Another emerging, though smaller contributing growth source of incremental gas supply, is gas associated with the production of oil. With the dramatic increase in Bakken oil shale production, and other oil production, the amount of associated gas will increase.
Demand growth for natural gas could help the supply/demand balance recover, though gradually, not overnight. Gas demand for power currently requires a whopping 22 Bcf/d (30% of our gas supply) and jumping to over 30 Bcf/d (35% of gas supply) by 2020. In my view, gas will be the power generation source of the future. Further, should the U.S. EPA (Environmental Protection Agency) environmental constraints apply to coal power generation plants, gas demand would increase further in the next decade. Our gas service team forecasts a 1.5%/yr increase in North American power generation in the next decade while gas usage for power generation will increase by 4.2%/yr. Figure 5 illustrates the growth of gas for power generation.
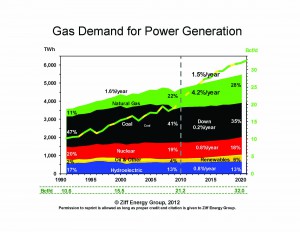
Figure 5: Gas Demand for Power Generation.
When it comes to processing and pipelines, fixed costs weight heavily, now. When the gas price received by the producer is low, the fixed cost components of processing and pipeline transportation “bite hard.” Most natural gas needs some processing, and “sour” gas
(gas containing sulphur) needs a lot! The gas processing plants are owned by gas producers, and midstream” specialist firms. Typically, the cost of processing is a fixed amount, though that can depend on many factors (age of the plant; percent utilization and the type of processes used), and if there is any nearby competition. There is no “average” processing cost; however, the cost to process non-shallow gas can range from $0.50 to $1.00+ per Mcf – or half of the current gas price!
Pipeline costs vary most by distance and by the newness of the pipe (newer pipelines tend to have a higher initial capital cost per mile of pipeline, and are less depreciated than older pipelines). Typically there is a rate for “firm” contracted capacity and a lower rate for short term “interruptible” capacity. Typical rates can be as low as $0.25-0.50 per Mcf in the south and central U.S., though much higher ($1-1.50/Mcf) on new pipelines from the U.S. Rockies.
A particularly challenging situation is the West/East toll for transporting gas from Alberta to Eastern Canada. With less total gas production in Canada, and increasing gas use by the Alberta oil sands, less gas is exported from Alberta. Due to the reduced throughput, the TransCanada toll has reached a high exceeding C$1.50+/Mcf (this is subject to a current Canadian rate hearing).
Who are the winners? One result of the low gas price is to stimulate industrial demand by “natural gas intensive process” industries such as ammonia and fertilizer. Many of these plants were priced out of the market during the period when gas prices exceeded $5/Mcf (during the late 1990s/early 2000s era) – competing international manufacturers were able to source much cheaper gas supply, such as Egypt or Trinidad, where the gas sales price is linked to the fertilizer price, a revenue-sharing approach.
During the high North America gas price period, imports of urea and ammonia amounted to the equivalent of 1 Bcf/d of gas imports while LNG imports exceeded 3 Bcf/d. The current low North American gas price, coupled with international industrials paying for gas at much higher prices, is leading to an industrial gas demand renaissance. Also, the traditional chemical users that use gas are benefitting.
Other groups of industrial users are the oil sands in Alberta and steam-tertiary projects in California. Oil sands mining projects use natural gas for heating water to help wash the bitumen (0.2 Mcf per barrel of oil sands production). Upgrading this bitumen typically requires an additional 0.5 Mcf per barrel (including gas for electricity generation). The other type of oil sands extraction, for deposits deeper than 250 feet is “thermal recovery”: SAGD (steam-assisted gravity drainage) is the most popular form – it typically uses 0.8-1.5 Mcf per barrel of produced oil, considerably more intensive than oil sands mining, because gas is used to generate steam to inject into the tar sands formation, enabling the thick, viscous oil to flow to the surface.
Another form of thermal (heat) recovery is CSS – cyclic steam stimulation, used at Imperial Oil’s major Cold Lake project, by CNRL’s Primrose project, and in Bakersfield, CA which normally uses 2-3 Mcf per barrel.
Who are the losers? Gas is, not oil! Everyone talks about the “oil and gas” industry; however, they are very different, especially their current price and economics. Figure 6 compares the oil (green) and gas (red) prices for the last six years. Currently gas sells for less than 1/40th the value of crude oil, compared to a heat content of 1/6. So the effective discount is more than 80%! When was the last time you were able to buy any basic essential for just 20 cents on the dollar?
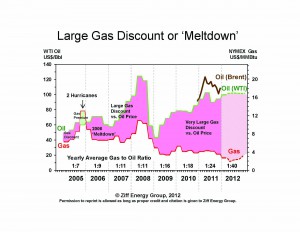
Figure 6: Large Gas Discount or “Meltdown.”
Figure 7 compares the producer netbacks from crude oil and from North American natural gas. At a price of $100/barrel, oil netbacks are at all-time peak levels, more than $60//barrel. At a price of $2/Mcf, gas produces virtually no net cash flow.

Figure 7: Oil/Gas Price And Margin/Cash Flow.
Virtually every producer of natural gas is hurting from the extremely low gas prices, and those operators that are primarily gas producers, whether very small or very large, are most impacted. Production from the traditional gas basins generally has high cost gas; gas with high processing costs is more impacted, as is gas that is more remote from markets (Western Canada, U.S. Rockies).
Producers that carry a debt burden on their balance sheets are most vulnerable – most are trying to sell assets to reduce their debt level, as their cash flow to support the interest cost has plummeted, while bankers are reducing loan authorization to reflect the lower reserve valuation.
The other big losers are the royalty owners – usually private sector in the U.S., and the major gas producing provinces (Alberta) in Canada.
The author can be contacted at 403-265-0600, paul.ziff@ziffenergy.com, www.ziffenergy.com.

Comments