
March 2011, Vol. 238 No. 3
Features
Overcoming Issues Associated With In-Line Inspection Of Gas Pipelines
Mechanical damage, corrosion and cracking are common threats affecting both liquid and gas pipelines. However, there are significant differences in the manifestations and frequency of these threats depending on the nature of the medium transported.
Whereas stress corrosion cracking (SCC) is by no means limited to one type of pipeline, a conclusive body of evidence shows that it predominantly poses a threat to gas pipelines 1. Similarly, top of the line corrosion (TLC), i.e. droplets of condensed gas leading to colonies of pitting corrosion, is hardly found in liquid lines but constitutes a considerable risk for gas lines 2. To complicate matters further, tool behavior, notably in terms of traveling speed, is more complex and problematic in pipelines used to transport gaseous products where specialized tool configurations are required to accommodate the pipeline’s specific flow and pressure conditions.
In order to reach the universal goal of any in-line inspection (ILI) of reliably and accurately determining the state of the asset, two basic conditions must be met. First, by making allowance for the flow and pressure conditions within the line, a smooth and controlled tool passage must be achieved to ensure optimal data collection. Second, the inspection tool must be fitted with adequate technology to ensure that the specific threats posed to gas pipelines such as SCC and TLC are consistently detected. Provided that these two basic conditions are met, knowledgeable and experienced analysts can then successfully overcome the specific issues associated with the in-line inspection of gas pipelines.
Cruise Control
Let us now consider cruise control: traveling slowly in a fast-flowing environment. Tool speed tends to be relatively constant in pipelines with liquid service for two reasons. Due to the incompressible behavior of liquids, product flow in the vicinity of the tool is identical to the speed of the tool itself. In addition, the inertial mass of the liquid prevents rapid changes in the speed profile. It is because these stabilizing factors are absent that tool speed is more difficult to control in gas pipelines. More specifically, because gas is compressible, gas pressure changes occur slowly, meaning that physical characteristics such as weld protrusions, wall-thickness changes, installations and even the inertial mass of the inspection tool itself all contribute to tool speed fluctuations.
However, to obtain precise and dependable inspection results, constant run speeds are indispensable. Given the current state of sensor design and capabilities, the ideal velocity range for ILI tools is now considered to be 1 – 5 m/s (2-11 mph). Since the speed in many gas transportation pipelines is significantly higher (up to 15 m/s (34 mph), speed control devices must ensure a difference in speed between the fast-flowing product and the slowly traveling inspection tool.
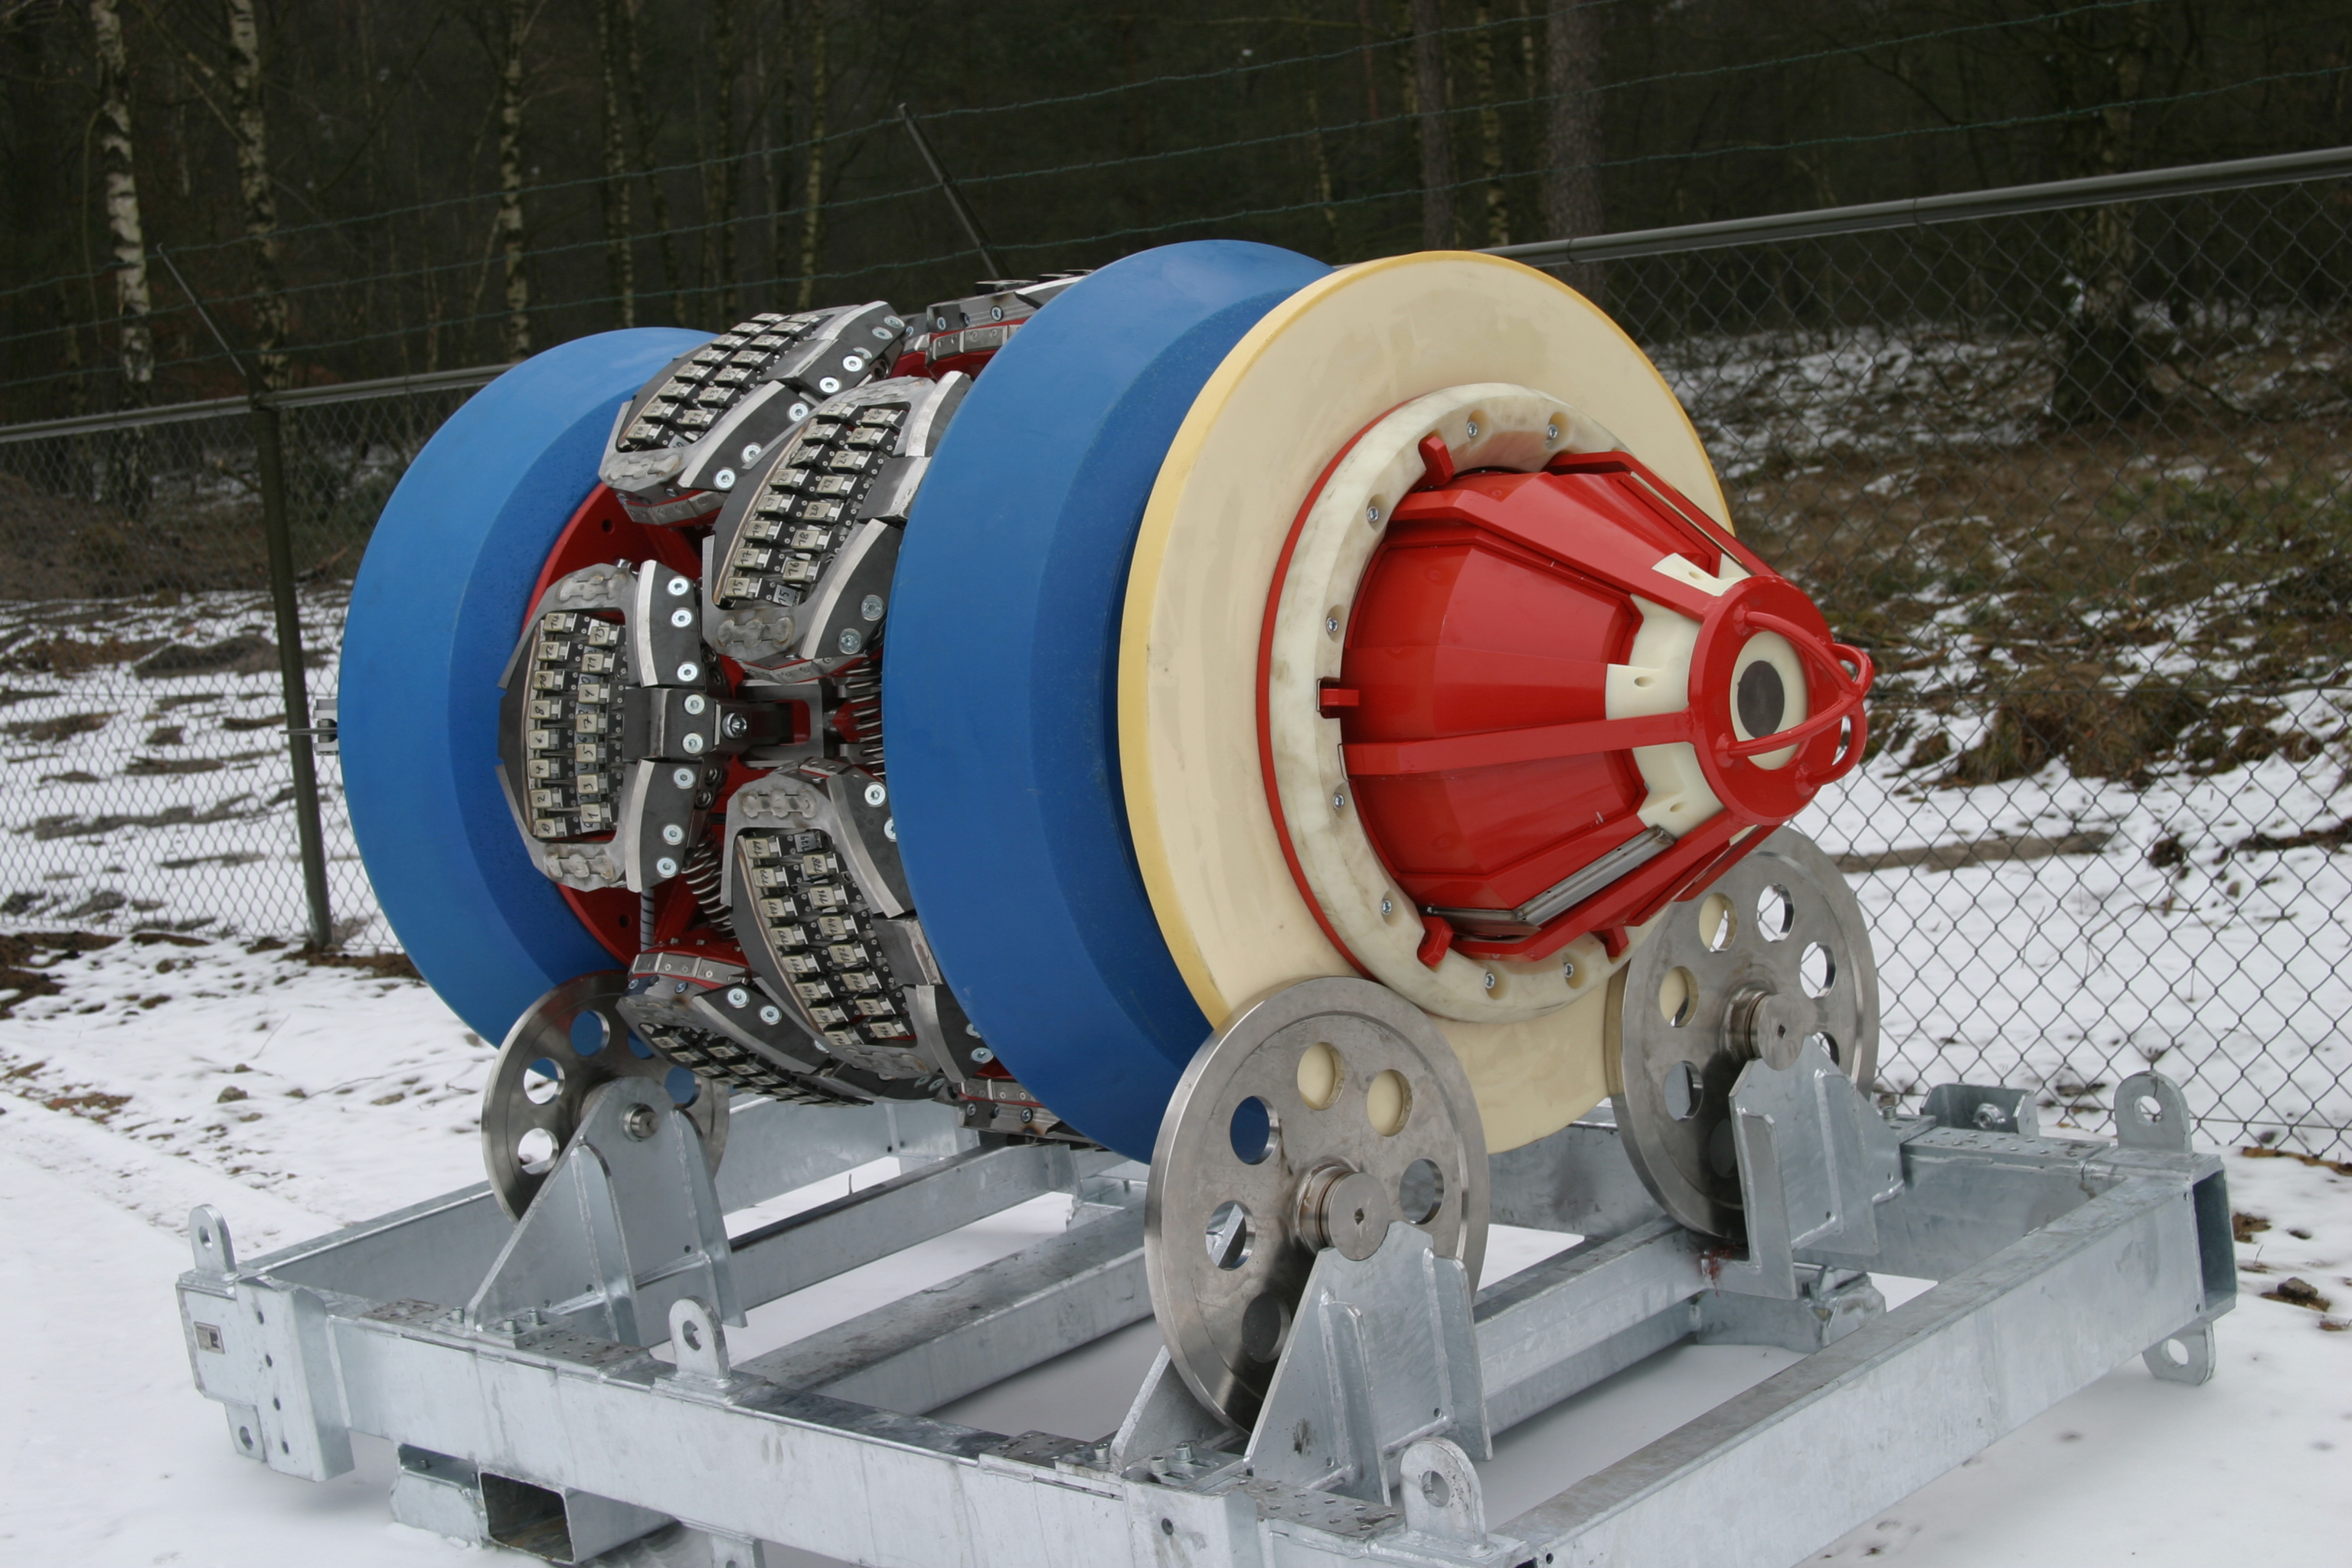
Speed reduction is achieved by equipping ILI tools with an active bypass valve (Figure 1). Because this valve allows the gas in the pipeline to flow at a higher speed than the tool, assets can be inspected without the need for a substantial reduction in production rates, leading to significant inspection cost reductions. How exactly does the bypass system work? The maximum speed difference between the gas flow and the inspection tool largely depends on the available cross sectional area of the bypass system. Essentially, if the tool is to slow down, more product is allowed to flow through the bypass valve. Conversely, the valve aperture is made smaller or closed completely to create more back pressure if the tool is to pick up speed.
Let us look now at overcoming speed fluctuations despite varying differential pressures. The second function of the speed control unit in addition to maintaining a predefined inspection velocity irrespective of gas flow velocity is to diminish temporary speed fluctuations caused by varying differential pressures across the tool. To achieve this aim, sensors constantly measure the actual velocity as well as the differential pressure. On the basis of these measurements, the valve position is then adjusted intelligently to offset variations in velocity to the greatest extent possible. For this purpose, a specific algorithm was developed based on a series of tool behavior simulations 3.
To demonstrate the efficiency of this control algorithm, two separate pipeline runs were conducted, as shown in Figure 2. Whereas no speed control was used in the first run (shown in blue in the graph), the second run involved active speed control. The two deflections in the graph represent strong speed fluctuations: in each case, the tool came to a complete standstill due to an installation. Back pressure was then built up until the tool accelerated to a very high rate.
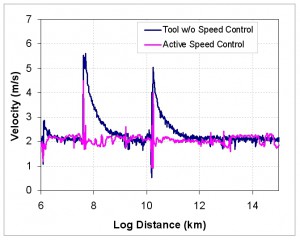
Figure 2: Tool run with (purple) and without (blue) speed control. Due to the efficiency of the speed control system used, there are significant differences in the two speed profiles.
As the graph shows, the tool with no speed control traveled at an accelerated rate for between 1 and 2 km (1.6 to 3.2 miles) before it resumed its normal velocity. In contrast, the valve used for speed control was fully opened in the second run as soon as the tool’s velocity exceeded the preset 2 m/s (4.5 mph). As a result, the device was down to its target speed again within a mere 0.050 km (0.08 miles). The speed control system thus achieved a deceleration distance reduction of 95%4.
Let us consider capitalizing on friction to optimize tool behavior under various pressure and flow conditions. Apart from increasing and decreasing product flow through the tool with an active bypass valve, tool speed can be further controlled by systematically exploiting another factor influencing tool behavior: the friction between the ILI tool and the surface of the internal pipe. This friction is, in itself, beneficial in common gas pipelines with an operating pressure of ? 30 bar (435 psi), since the tool’s drag can offset the gas flow to a certain degree, thereby permitting higher gas flow during in-line inspections.
However, the situation is reversed in conditions of reduced pressure and flow conditions. As a result of the reduced absolute pressure, a high differential pressure across the inspection tool cannot be realized. In consequence, low-pressure applications call for low-friction configurations. Nevertheless, the sealing capabilities of the tool must not be compromised, as such low-flow pipelines require a zero bypass drive system.
From an inspection point of view, low flow / low pressure (LF/LP) pipelines can be divided into four categories with two different pressure ranges and flow ranges (Table 1). The first category requires a specially designed tool and an engineering study. Not all pipelines within C01 are piggable. The second and third categories are requesting special tools with LF/LP adaption kits. The fourth category requires simply a specially optimized tool configuration.
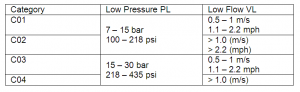
Table 1: Categorization of LF/LP Pipelines. C01 requires an engineering study and a special inspection tool. C02 and C03 can be inspected with modified inspection tools (adaption kit). C04 can be addressed by optimizing the tool configuration.
The most common inspection method for measuring corrosion uses magnetic flux leakage technology (MFL). In short, a strong magnetic field is applied to the pipe wall from permanent magnets coupled beneath wear brushes that provide protection against debris and damage inside the pipe during an inspection survey. Any deviation from the established nominal magnetic field is used to identify wall loss using the tool’s sensor readings. While the brushes serve a valuable purpose they also increase the friction between the pipe wall and the inspection tool. To reduce this drag effect in low-pressure pipelines, non-magnetic rollers are typically used instead of standard brushes (Figure 3).
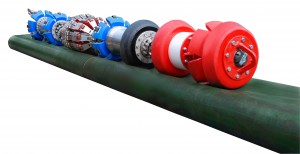
Figure 3: 12-inch intelligent in-line inspection tool configured specifically for low flow / low pressure pipelines. To minimize friction for a smooth run performance, non-magnetic rollers (mounted on the blue cups) are used.
The wheeled magnet unit shown in Figure 3 achieves a friction reduction up to a factor of 2 compared to standard wear brushes. A careful choice of sealing and drive cups is particularly important in the inspection of pipelines with small diameters (<16 inches)="" for="" which="" the="" cups="" are="" designed="" minimal="" but="" constant="" friction.="" reason="" this="" design="" type="" is="" that="" major="" changes="" in="" friction="" caused="" by="" variations="" internal="" bore,="" e.g.="" girth="" weld="" protrusions="" or="" wall="" thickness,="" must="" be="" avoided,="" because="" they="" could="" cause="" excessive="" acceleration="" following="" after="" a="" complete="" stop.="" three="" different="" cup="" designs="" presented="" figure="" 4.="" besides="" standard="" intended="" to="" carry="" high="" loads,="" low="" and="" wheel="" shown.="" incorporated="" into="" sealing="" components="" of="" tool,="" while="" carries="" additional="" measurement="" electronic="" units.="" low-friction="" shown="" 3.="" [inline:fig4_friction="" behavior.jpg]="" 4:="" dynamic="" force="" demonstrated="" designs.="" behavior="" illustrates="" preferred="" change="" as="" function="" thickness.="" still,="" at="" higher="" thickness="" (16="" mm="" case)="" will="" eventually="" increase="" disproportionate="" rate.="" so="" similar="" other="" configurations,="" application="" range="" with="" regards="" should="" not="" exceeded="" during="" an="" inspection="" beyond="" certain="" limitations.="" pipe="" bore="" known="" advance="" before="" selecting="" optimized="" tool="" set-up="" pressure,="" flow="" pipeline="" conditions.="" consider="" necessary="" steps="" choosing="" most="" suitable="" in-line="" technology="" detect="" anomalies="" gas="" pipelines.="" once="" pressure="" conditions="" have="" been="" ascertained="" measures="" taken="" warrant="" smooth="" controlled="" passage="" optimal="" data="" collection,="" operators="" next="" define="" detecting="" specific="" threats="" posed="" their="" transportation="" asset.="" crucial="" factor="" here="" detection="" sensitivity="" various="" types="" technologies="" particular="" feature="" types.="" addition,="" it="" imperative="" chosen="" method="" capable="" identifying="" defect="" detected="" features.="" asset="" integrity="" management="" programs="" incorporate="" classification="" parameters="" enable="" identification="" categorization="" acceptable="" probability.="" development="" new="" adaptation="" existing="" recent="" years="" has="" led="" enlarged="" sophisticated="" methods="" challenging="" environments="" such="">EMAT Technology
Look at electro-magnetic acoustic transducer (EMAT) technology for cracks and coating disbondment. Whereas the occurrence of cracks is a phenomenon that can be observed in any type of pipeline, particular types of cracks — notably stress corrosion cracking (SCC) — are primarily found in gas lines. As part of a systematic program aiming at reducing SCC in pipelines regulated by the Canadian Energy Board (NEB), the Canadian Energy Pipeline Association (CEPA) investigated large numbers of SCC colonies in Canadian pipelines. Whereas 17,925 such cases were found in gas pipelines, only 366 instances of SCC were investigated in liquid pipelines 1, 10, 19.
In view of these findings, the development of an inspection technology which is not only sufficiently sensitive to detect SCC and other forms of cracking but which can also be used in gas pipelines without the need for a liquid batch is undoubtedly a major advancement. The latest generations of EMAT technology have increasingly fulfilled these criteria. Therefore, it is not surprising that this method is now being established as an additional and suitable option for detecting SCC in gas lines 10,11.
Typically, high-resolution EMAT inspection systems feature two measurement units equipped with a number of electro-magnetic acoustic transducers sufficiently large to warrant complete coverage of the internal pipeline surface. In a nutshell, the transducer generates an ultrasonic pulse. The waves reflected by the pipeline wall then induce varying electric currents in the receiver. Since any faults and notably cracks along the wall result in only a partial reflection of the original signal, these current signals can be used to determine the state of the pipe wall. More precisely, because the speed of ultrasound along the pipeline wall is known, the properties of each crack including its depth can be calculated. For a more detailed account see references 12-14. To enhance the reliability and sensitivity of this method further, a high-resolution concept incorporating multiple channels for detection is used (Figure 5).
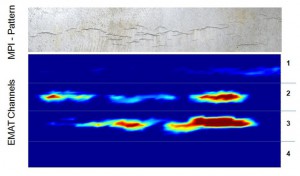
Figure 5: The bottom part of the illustration shows a single SCC colony registered by four individual EMAT channels. This information is complemented by the results obtained through magnetic particle inspection (MPI, top part of the image) to ensure more reliability and thus support the subsequent evaluation process.
The sensitivity threshold for individual cracks accepted throughout the pipeline industry is 30 mm (1.18-inch) in length and 1 mm (0.039-inch) in depth, although some argue that this is too conservative 15-17. A thorough sensitivity analysis conducted by ROSEN involving a combination of artificial and natural crack-like features revealed that EMAT technology easily meets the target of detecting even sub-critical flaws 18. The minimum dimension found for EMAT was 20 mm (0.79-inch) in length and 0.65 mm (0.026-inch) in depth with a probability of detection (POD) of 92%. Flaws with a smaller depth were also investigated. Crack-like anomalies 20 mm (0.79-inch) in length and 0.42 mm (0.017-inch) in depth were detected with a POD of 44%.
In addition to EMAT, a novel technology using the electromagnetic excitation of ultrasonic waves is now available for the detection and characterization of cracking in gas pipelines which, again, can dispense with the kind of liquid coupling normally required for UT sensors. Thanks to these advances, cracks have become easier to inspect even in challenging gas lines.
Coating Disbondment
EMAT is not only highly suitable for the detection of cracks but also for coating assessments, notably for ascertaining the presence of coating disbondment in pipelines. The condition of the external pipeline coating is an important aspect of the integrity assessment process, because coating disbondment is known to be a precursor of SCC. Since some types of coating disbondment are more likely to lead to SCC defects than others, the ability to distinguish among different types of defects is greatly beneficial to asset integrity programs.
The EMAT inspection system is capable of providing characteristics about the coating type itself and the nature of disbondment. Figure 6 details the variations in transmission amplitude resulting from different coating types such as coal tar coating and fusion bonded epoxy (FBE) coating. Similarly, disbonded areas are identified by a change in transmission amplitude and reported as individual features.

Figure 6: Field results from a 16-inch pipeline inspection. EMAT technology is capable of identifying different types of coating on the basis of the transmission amplitude.
Dents And Geometry
Look at the revelation of dents and pipeline geometry on the basis of a mechatronic solution. Based on purely mechanical movement, the mechanical caliper tools traditionally used to detect the geometry of the internal bore have a tendency to lose contact with the internal surface of the pipeline 5. To prevent such contact loss, the purely mechanical movement method must be used at low speeds. Therefore, it is not a suitable inspection method for gas lines with high flow rates.
The addition of a touchless measurement component overcomes this problem. A touchless electronic proximity sensor is integrated inside the sensor head and an arm position sensor attached to the bottom monitoring the mechanical position of the sensor arm (Figure 7).

Figure 7: The mechatronic solution: a touchless electronic sensor is integrated inside the sensor head and a position sensor attached at the bottom monitors the mechanical position of the sensor arm.
As part of this mechatronic solution, a touchless electronic sensor based on eddy current technology (EC) is used to compensate for any unwanted inertia. Moreover, because the electronic sensor is insensitive to non-conductive material, this compensation method ensures that the data collected invariably refers to the metal internal surface of the pipeline wall rather than irrelevant material such as scale, wax or debris which must not affect the geometry evaluation of the pipeline.
A single mechatronic unit can accurately detect, identify and size features at a tool speed of up to 5 m/s (11.2 mph). In addition, case studies attest to the high precision of this method: the accuracy level attained in one study measuring out-of-roundness patterns was 0.6 mm (0.023-inch) 6. Last but not least, this method very reliably reports sharp transitions at the internal surface such as pipe misalignments at a girth weld.
Internal Corrosion
Now let us look at how to cope with corrosion by employing combined inspection technologies. The growth of internal corrosion can be the main risk for gas pipelines 7. Top of the line corrosion (TLC) is a case in point. The result of condensation in wet gas lines, this threat was not fully recognized until this decade. It is now known that if the concentration levels of initiators such as carbon dioxide and sulfur or organic acids reach certain levels, TLC growth rates can be as severe as several millimeters per year 8.
To detect corrosion in pipelines, combined inspection technologies are used. As part of this symbiotic approach, the high-resolution geometry sensor is further enhanced with shallow internal corrosion (SIC) probes for absolute measurement of the depth of SIC defects. The absolute measuring data collected with this method complement the relative wall loss measurements supplied by the second inspection technology used in this combined approach: Magnetic Flux Leakage (MFL). Generally the most common inspection method for measuring corrosion, MFL involves the application of a strong magnetic field to the pipe wall from permanent magnets. Detected by the inspection tool’s sensors, any deviation from the established nominal magnetic field is then used to identify wall loss.
Especially in the inspection of heavy wall lines, shallow internal corrosion measurements taken with mechatronic geometry probes often outperform MFL depth sizing. However, since the two methods complement each other, the SIC measurements assist MFL defect identification and depth sizing by enabling increased distinction of individual pits in dense clusters due to the high lateral resolution of the defect surface measurements.
This combined approach thus allows operators to estimate the marginal corrosion growth rates as a basis for monitoring the asset degradation process and predicting failure pressures and asset life expectancies in the context of design guidelines 9. Figure 8 juxtaposes a photo of pitting corrosion in a steel plate and its visual representation on the basis of shallow internal corrosion sensor data. The excellent depth sizing performance and great high-resolution mapping capacity of this technology set new standards for corrosion growth monitoring.

Figure 8: Photograph of a steel plate affected by a cluster of pitting corrosion at the top of the line (left) with a visual representation of the same defect (right) obtained by using a shallow internal corrosion sensor. This method achieves outstanding depth sizing results.
Conclusion
Due to characteristic threats such as SCC and TLC on the one hand and difficult tool behavior control on the other, gas pipelines pose specific challenges. However, the development of active speed control devices for low pressure and low flow conditions means that tool behavior can now be controlled to an extent where the need for a product flow reduction is eliminated. Similarly, new generations of inspection technologies provide enhanced characterization of anomalies predominantly found in gas pipelines and even allow operators to dispense with liquid coupling. Since different gas pipe conditions and features require specific speed control and inspection technologies, it is imperative that operators judiciously select the most suitable technology configuration to ensure optimal detection of all anomalies and minimal disruption of production. Overall, the advances made in recent times facilitate well-informed asset integrity management decisions and thus make an important contribution to overcoming the specific issues associated with the in-line inspection of gas pipelines.
The authors:
Thomas Beuker is marketing manager at the ROSEN Group and responsible for the business segment pipelines. He can be reached at tbeuker@roseninspection.net.
Dr. Stephan Brockhaus is the head of the operational departments of the ROSEN Technology & Research Center in Germany and manages inspection services utilizing newly developed technologies.
Dr. Hubert Lindner is ILI tool expert at the Research & Development Department in Germany. He is responsible for tool related mechanical and operational basic definitions and company wide support for special ILI challenges.
References
1 Paviglianiti, J. et al., An Analysis of Significant SCC Data Reported to the National Energy Board, Proceedings of Rio Pipeline 2007, Paper IBP1596_07, October 2007.
2 Gunaltun, Y. et al., Top of Line Corrosion in gas lines confirmed by condensation analysis, OGJ, Vol97, 28, July 1999.
3 Rahe, F., Optimizing the Active Speed Control Unit for In-Line Inspection Tools in Gas, Proceedings of The International Pipeline Conference, Calgary 2006, Paper IPC2006-10260, October 2006.
4 Beuker, T. et al., Re-Assessment Survey of Large Diameter pipelines using Compact Multi-Purpose Inline Inspection Tools, Proceedings of The International Pipeline Conference, Calgary 2004, Paper IPC2004-0698, October 2004.
5 Beuker, T. et al., High-Quality Smart-Pig Inspection of Dents, Compliant with the Code of Federal Regulations for Gas and Liquid Transportation Lines Parts 192 and 195, Proceedings of Pipeline Pigging & Integrity Management Conference, February 2005.
6 Paeper, S. et al., Measuring the “mu” with In-Line Inspection Tools in Baseline Surveys of Pipelines,” to be published in World Pipelines, August 2009.
7 Argent, C. et al., Macaw’s pipeline defects. s.l. : Yellow Pencil Marketing, 2003. ISBN 0-9544295-0-8.
8 Singer, M. et al.,CO2 top of the line corrosion in presence of acetic acid: A parametric study, Proceedings of . NACE CORROSION 2009, Atlanta 2009, Paper No. 09292, March 2009.
9 DNV. Submarine Pipeline Systems. 2007. DNV-OS-F101.
10 The Canadian Energy Pipeline Association (CEPA), “Stress Corrosion Cracking,” Recommended Practices 2nd Edition, Canada, December 2007.
11 Al-Oadah, A. et al., “In-line Inspection with High Resolution EMAT Technology – Detection of Cracks and Coating Disbondment,” Proc. NACE Corrosion 2007, Paper 07131, Nashville, TN, 2007.
12 Beuker, T. et al., “SCC Detection and Coating Disbondment Detection Using the High Resolution EMAT ILI-Technology,” Proc. IPC 2004, Paper 0697, Calgary, Canada, 2004.
13 Klann, M. et al., “Pipeline Inspection with the High Resolution EMAT ILI-Tool: Report on Field Experience,” Proc. IPC 2006, Paper 10156, Calgary Canada, 2006.
14 Damaschke, J. et al., “First Surveys Run with Electromagnetic Acoustic Transducer,” Pipeline & Gas Journal, October 2006.
15 Katz, D. et al., ”Advances In Crack Assessment For Pipeline Integrity” 11th International Conference of Fracture, (ICF11), Paper 5068, Turin, Italy, 2005.
16 Beller, M. et al., “Multi-Diameter and Quantitative Inspection Technologies for Offshore Pipelines,” Proceedings PPSA Seminar, Aberdeen, November, 2005.
17 Anon., “Crack Detection,” GE document, CD_NA_071406, July 2006.
18 Döscher, C., ECD Detection, Detection of Shallow Anomalies, ROSEN document, ECD_PA_003_1_1, Jun 2007.
19 National Energy Board, “Report of the Inquiry concerning Stress Corrosion Cracking,” Canada, December 1996.

Comments