
September 2010 Vol. 237 No. 9
Features
GIS Helps Identify Red Zones For Gas Leakage In Pakistan
As a result of the aging of the pipeline network and corrosion and damage activities, there is an increasing trend of gas leakage complaints on the Sui Southern Gas Company Limited (SSGC) gas distribution system in Pakistan. Thus, the percentage of unaccounted for natural gas (UFG) is continuously rising. Spotting and managing gas leaks are important in this era in Pakistan.
This article shares experiences which SSGC has gained working to identify gas leakage “Red Zones” using GIS in its Karachi region for conducting mobile gas leakage surveys and subsequently for pipeline rehabilitation work.
The natural gas industry in Pakistan has historically grown out of oil exploration and developments efforts. The structure of the industry has evolved considerably in the past six decades. Natural gas in Pakistan is strictly an internal fuel. It is one of the cheapest and most efficient energy sources for the economic growth of Pakistan. It is the biggest fossil fuel, contributing nearly half of total energy supplies. Over the years, it has replaced coal and oil in various industrial sectors. Natural gas surpassed oil as Pakistan’s leading energy fuel in 2002. In 2009, it contributed 48.3% to serve the energy supply needs of Pakistan’s 160.97 million people.
Pakistan has a well-developed and integrated transmission and distribution pipeline network for the supply of natural gas to end consumers. SSGC operates its business in the southern provinces of Pakistan with a transmission and distribution pipeline network system of more than 3,200 km of transmission lines and 34,282 km of distribution.
SSGC’s franchise area was initially served by three independent companies, but with the merger of these companies, SSGC emerged in 1989. Pakistan’s first-ever gas distribution pipeline was laid in 1955 in the city of Karachi. Natural gas became available through the gas distribution system to industrial, commercial and domestic consumers of Karachi in October 1955. It was introduced in power generation when Karachi Electric Supply Corporation’s (K.E.S.C.) first boiler was deployed. Karachi is the largest and the fastest growing megacity of Pakistan with a population in 2006 exceeding 16 million.
Being Pakistan’s most densely populated, largest metropolitan and industrial city, Karachi has the largest natural gas distribution network and consumer base in Pakistan while it accounts for 40% of the gas distribution network assets and 66% of consumers in SSGC’s franchise area. Figures 1(a) and 1(b) show the expansion of the gas distribution network system and gas consumers in SSGC’s Karachi region from 1980-2009. SSGC’s gas distribution system can be classified into three categories: (1) Supply Mains Pipeline, (2) Distribution Mains Pipeline, and (3) Service Pipelines. All categories are cathodically protected against corrosion.


Gas supply mains pipelines represent relatively high or medium gas pressure and large-diameter gas pipes. They are just like major roads in a city. Gas distribution mains consist of low-pressure interconnected pipeline networks which carry natural gas from supply mains to points adjacent to customer premises. Natural gas runs from the distribution main to the consumer’s gas meter through a service pipeline. The gas distribution system is comprised of varying pipe sizes ranging from 3/4-inch to 42 inches in diameter with steel and polythene material.
Previously, most of the pipeline asset information in SSGC was stored in the form of traditional hardcopy maps and in some digital sources. No centralized data management system for development, storage and restoration of the maps/information existed. Maps and other information are stored in the company’s regional offices. It was also noted that in some cases, field crews were called on to recollect from memory the location of pipelines or their associated features.
Continuous growth of domestic, commercial and industrial sectors along with the pipeline network were resulting in an enormous number of hardcopy maps. Therefore, day-to-day handling, storage, re-storage, and maintenance of these maps was not only a big challenge but difficult to handle as well. Also, management, operation, maintenance, safety, inspection and analysis activities of these geographically dispersed natural gas supply pipeline assets were become very difficult. Therefore, to address these issues, SSGC implemented a Geographic Information System (GIS) for its entire gas transmission and distribution network in 2006. Gas pipeline networks and other geographic information which were previously stored on hardcopy maps with variable scales have been integrated and planners or decision makers now have the access to visualize, query and print the seamless information through Web-based IS application.
Problem And Solution
Due to aging, corrosion and damage activities, there is an increasing number of gas leakage complaints on the gas distribution system. Every year, there is also a continuous increase in the percentage of unaccounted for natural gas (UFG). If one considers the whole franchise area of SSGC, the UFG situation is alarming. In 2008, the UFG for the Karachi region was 3.75% and in 2009 rose to 4.88%.
Currently, there is no proper method and schedule set for leak-detection surveys. Leaks are detected and rectified only when the consumer complains about the gas leakage on the distribution main pipeline, service pipeline or house gas line. Generally, complaints are received in the “Call Center” and forwarded to emergency responders of the Customer Relations (CRD) and Distribution System Management (DSM) departments through the enterprise Customer Information System (CIS). Gas leaks on service and house lines are immediately fixed by emergency responders while gas leaks on distribution main pipelines may take time to be rectified.
Previously, no records after maintenance of gas pipeline leaks were maintained, even on hardcopy maps. However, with the implementation of a Customer Information System (CIS) in 2007, gas leakages fixed by CRD or DSM are maintained in CIS. With the transformation of existing GIS or implementation of ESRI’s out-of-the-box ArcGIS Gas Distribution GIS model, SSGC would be able to use GIS for maintenance and operation of both existing gas and forthcoming distribution pipeline networks.
Recently, SSGC has taken several serious measures to control the rapid increase in the UFG percentage. Among other measures, gas leak detection surveying and rehabilitation work for the pipeline network are of top priority. Both activities require a huge investment. Manual leak detection surveying is a time-consuming job; therefore, SSGC is focusing on modern equipment and tools like mobile gas leak detection survey technology using existing GIS information. Mobile gas leak detection survey technology can be embedded with GIS and GPS which will help in identifying gas distribution mains along the streets in real time during the survey.
Without prioritizing areas or answering the following questions, conducting gas leak detection survey and rehabilitation work on existing gas distribution mains pipeline network would be a nightmare: (1) which area has a high concentration of gas leakages, and (2) what is the gas distribution main footage by vintage for gas leak detection surveying?
GIS technology has been proven in addressing these queries by identifying “Red Zones” in the Karachi region. Here, a “Red Zone” is simply defined as an area which has a high concentration of gas leakage complaints for gas distribution mains.
For meter reading and gas bill distribution purposes, SSGC has divided its customer billing system into units, regions, zones and sub zones in the Customer Information System (CIS). “Billing Region” is the largest administrative or geographic area and “Billing Area” is the smallest administrative unit. Each gas consumer has a specific billing area number. There are more than 700 billing areas in Karachi whose geographic boundaries, along with their code/numbers, are placed in the GIS system.
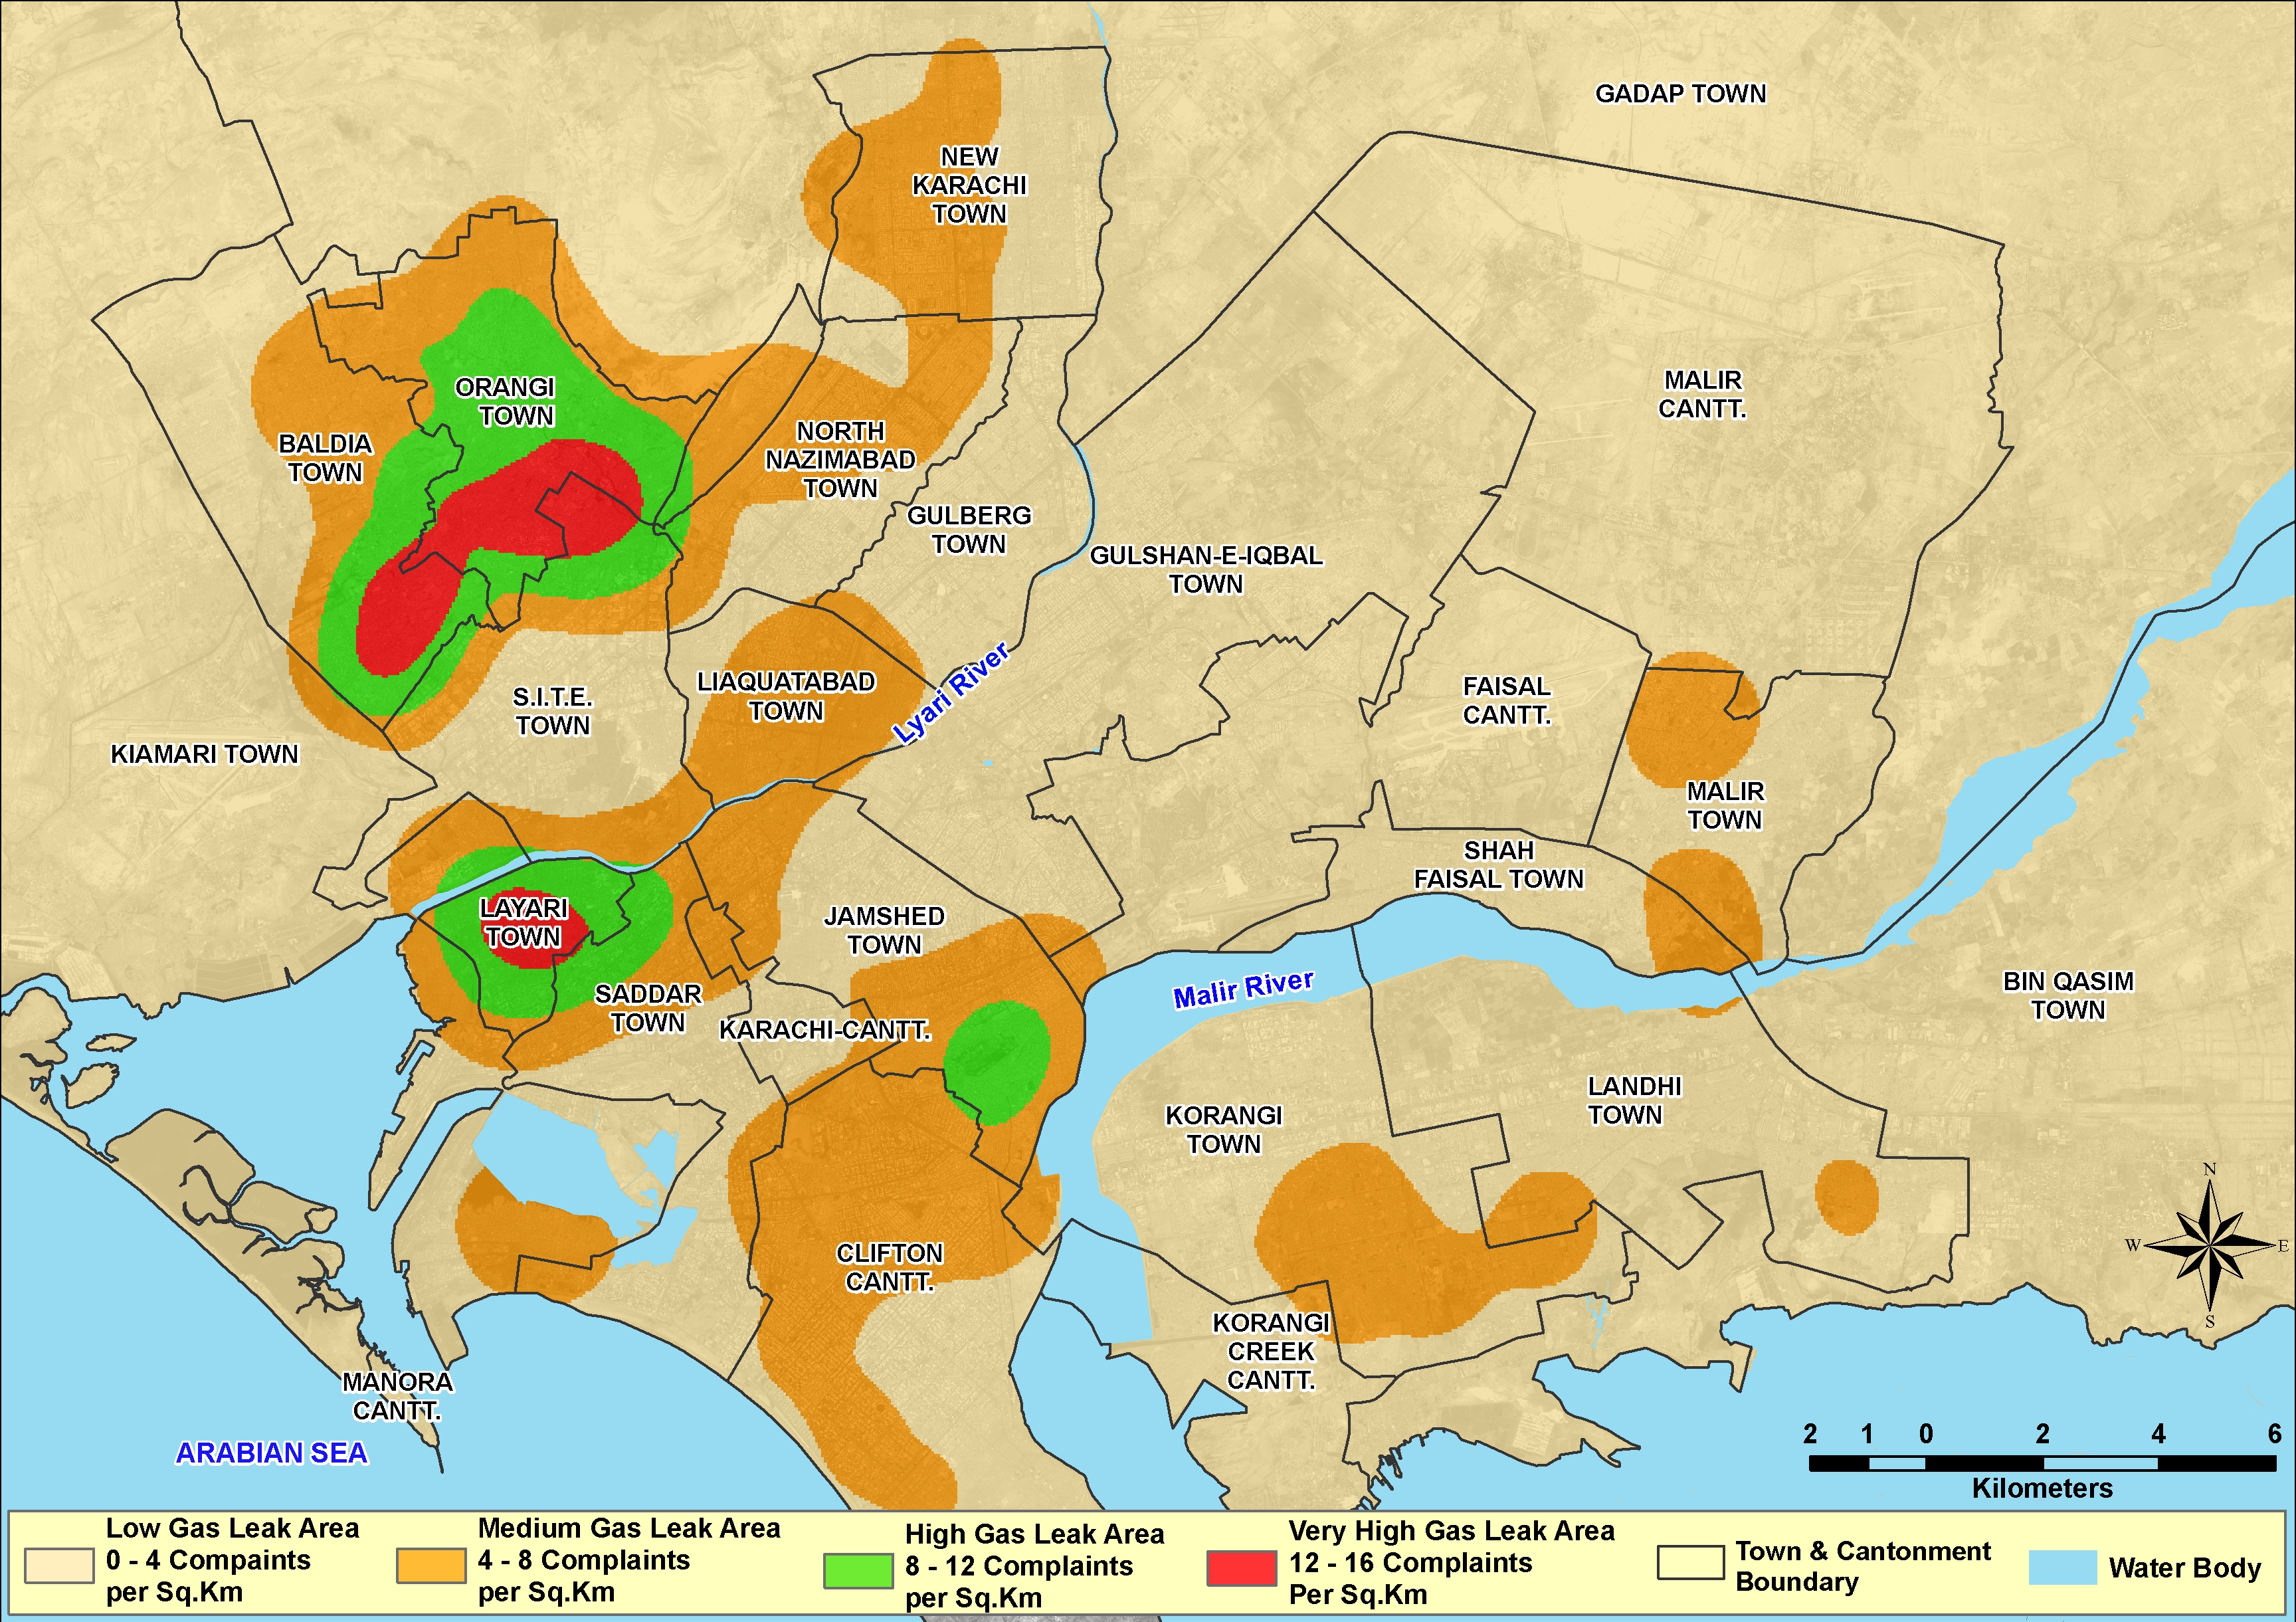
All gas distribution main pipeline leakage complaints which had been rectified and recorded as “Completed” in CIS have been tagged with the “Billing Area” polygon layer of GIS. The “Billing Area” layer with attributes of gas leakages was then converted into Point layer (at Centroids) in order to interpolate it to a continuous surface (layer) representing gas leakages per square km. Gas leakage density was computed by using the density function of the Spatial Analyst extension of ArcGIS and classified into four categories, i.e., with Low, Medium, High and Very High Gas Leakage areas. Figure 2 (see top of page) shows SSGC’s Karachi Region gas leakage pattern.
Results
Maps and statistical results reveal that a large extent of the Karachi region does not have a gas leakage problem. High or very high gas leakage areas are mainly found in the old, thickly populated and congested areas like in Lyari, Orangi, Baldia and S.I.T.E towns in the northwest part; Lyari and Saddar towns in the western part; and Jamshed town in the southern part of Karachi. Lyari town is one of the oldest areas in Karachi. Major expansion of gas distribution mains occurred during 1991-2000, especially in Orangi and Baldia. Therefore, they have the largest share of the gas distribution mains network in the “Red Zone.” About 1,030 km and 142 km of distribution mains are of steel and polythene type, respectively, while about 549 km and 623 km pipelines were laid before 1991 and after 1990, respectively. Figure 3 shows age-wise total gas distribution main network in high and very high gas leakage areas.
Conclusion
This article has examined how SSGC obtained benefits from GIS for the identification of gas leakage “Red Zones.” In the Karachi region, mobile gas leak detection survey work now can be prioritized on the basis of high and very high gas leakage complaint areas along with pipeline aging information. Also, based on the survey results, gas distribution mains rehabilitation work can be done efficiently and economically. In the near future, with the implementation of the ArcGIS Gas Distribution Model, SSGC will be able to identify gas leakages precisely on the gas pipeline. It is also recommended to use a GPR (Ground Penetrating Radar) technology for remote identification of underground gas leakages.
Acknowledgment
We would like to express our deep and sincere gratitude to all GIS and CIS team players of SSGC. Their hard work on the implementation of GIS and CIS in the company has been of great value and has enabled us to execute decision making and intelligent analysis at the right time and in the right direction.
Authors:
Irfan Zafar is a chief information technology officer and head of the IT department at Sui Southern Gas Co. Ltd., Karachi, Pakistan. His primary responsibilities are to look after and manage overall IT-related activities in the company.
Dr. Syed Ali Naqi is a project manager and head of GIS Section (IT department) at Sui Southern Gas Co. Ltd. Along with GIS based analysis, his primary responsibilities are to manage in-house development and maintenance of enterprise GIS. Contact Ph: 9221-99021509 or ali.naqi@ssgc.com.pk. URL: www.ssgc.com.pk.
Dr. Syed Jamil Hasan Kazmi is a pioneer of Geo-informatics Technology in Pakistan. He is a professor at the Department of Geography, University of Karachi. He was a Senior Fulbright Fellow at the Department of Geography, University of Georgia (U.S.) where he did his post-doctorate work in 1999.
References
HDIP (2009), Pakistan Energy Yearbook, 2009, Ministry of Petroleum & Natural Resources, Government of Pakistan, Islamabad, Pakistan.
Hussain, K. (2010), Sui Southern, Loss of Rs. 740 Million within One Year, DAILY EXPRESS, March 28, 2010, Century Publications, Karachi, Pakistan.
Munshey, A. S. (1997), Highlights and Information, Corporate Planning Department, Sui Southern Gas Company Limited, Karachi, Pakistan, pp 1-16.
Siddiqui, Z., and Naqi S. A. (2006), Systematic GIS Development and its Successful Implementation in SSGC-Pakistan, Proceedings of 2006 ESRI International User Conference, August 7-11, San Diego, California, U.S.A.
SSGC, Annual Reports for 1989, 1995, 2000, 2005 and 2009, Sui Southern Gas Company Limited, Karachi, Pakistan.

Comments